Micron M500DC (480GB & 800GB) Review
by Kristian Vättö on April 22, 2014 2:35 PM ESTRandom & Sequential Performance
We are currently in the process of updating our enterprise SSD test suite and the new random and sequential performance tests are the first fruits of that. In the past our tests were set to a certain queue depth (mostly 32 in the enterprise tests), which didn't give the full picture of performance. As enterprise workloads are almost always unique, the queue depths vary greatly and the proper way to test performance is across all the possible queue depths. In our new tests we are now testing queue depth scaling from one to all the way to 128. While it's unlikely for enterprise workloads to have small queue depths, testing them gives us an important look into the architecture of the drive. Similarly, it's rare for even the more demanding enterprise workloads to exceed queue depth of 64 but we are still including the 128 in case it matters to some of you.
Since we are testing an enterprise class drive, we cannot look at the performance in a secure erased state as that would be unrealistic. Enterprise workloads tend to stress the drive 24/7 and thus we need to simulate the worst case performance by preconditioning the drive into steady-state before running the actual tests. To do this, we first fill the drive with sequential 128KB data and proceed with 4KB random writes at a queue depth of 32. The length of the torture depends on the drive and its characteristics but in the case of the M500DC, I ran the 4KB random write workload for two hours. As the performance consistency graphs on the previous page show, two hours is enough for the M500DC to enter steady-state and ensure consistent results.
After the preconditioning, we tested the performance across all queue depths at full LBA with Iometer. The test was ran for three minutes at each queue depth and the next test was started right after the previous one to make sure the drive was given no time to rest. The preconditioning process was repeated before every test (excluding read tests, which were run right after write tests) to guarantee that the drive was always in steady-state when tested.
4KB Random Performance
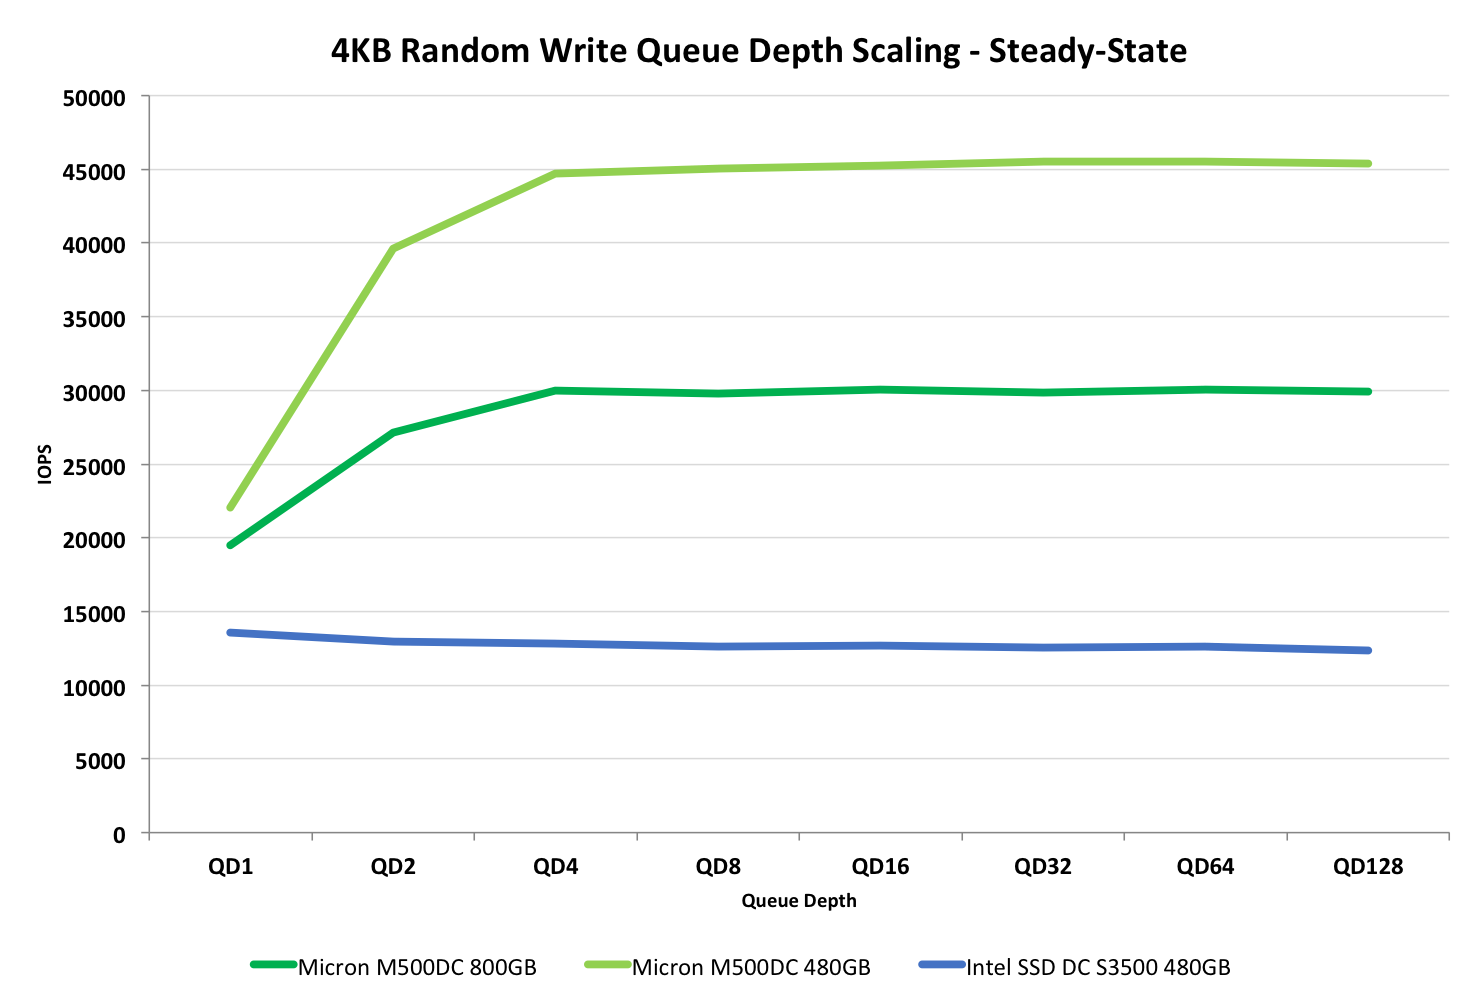
The random write scaling graph shows pretty much the same as our consistency tests. After the queue depth of four the performance reaches its limit and no longer scales. Interestingly, the DC S3500 doesn't scale at all, although it's performance is low to begin with when compared with the M500DC. (This is due to the difference in over-provisioning -- the S3500 only has 12% whereas the M500DC has 27/42%.)
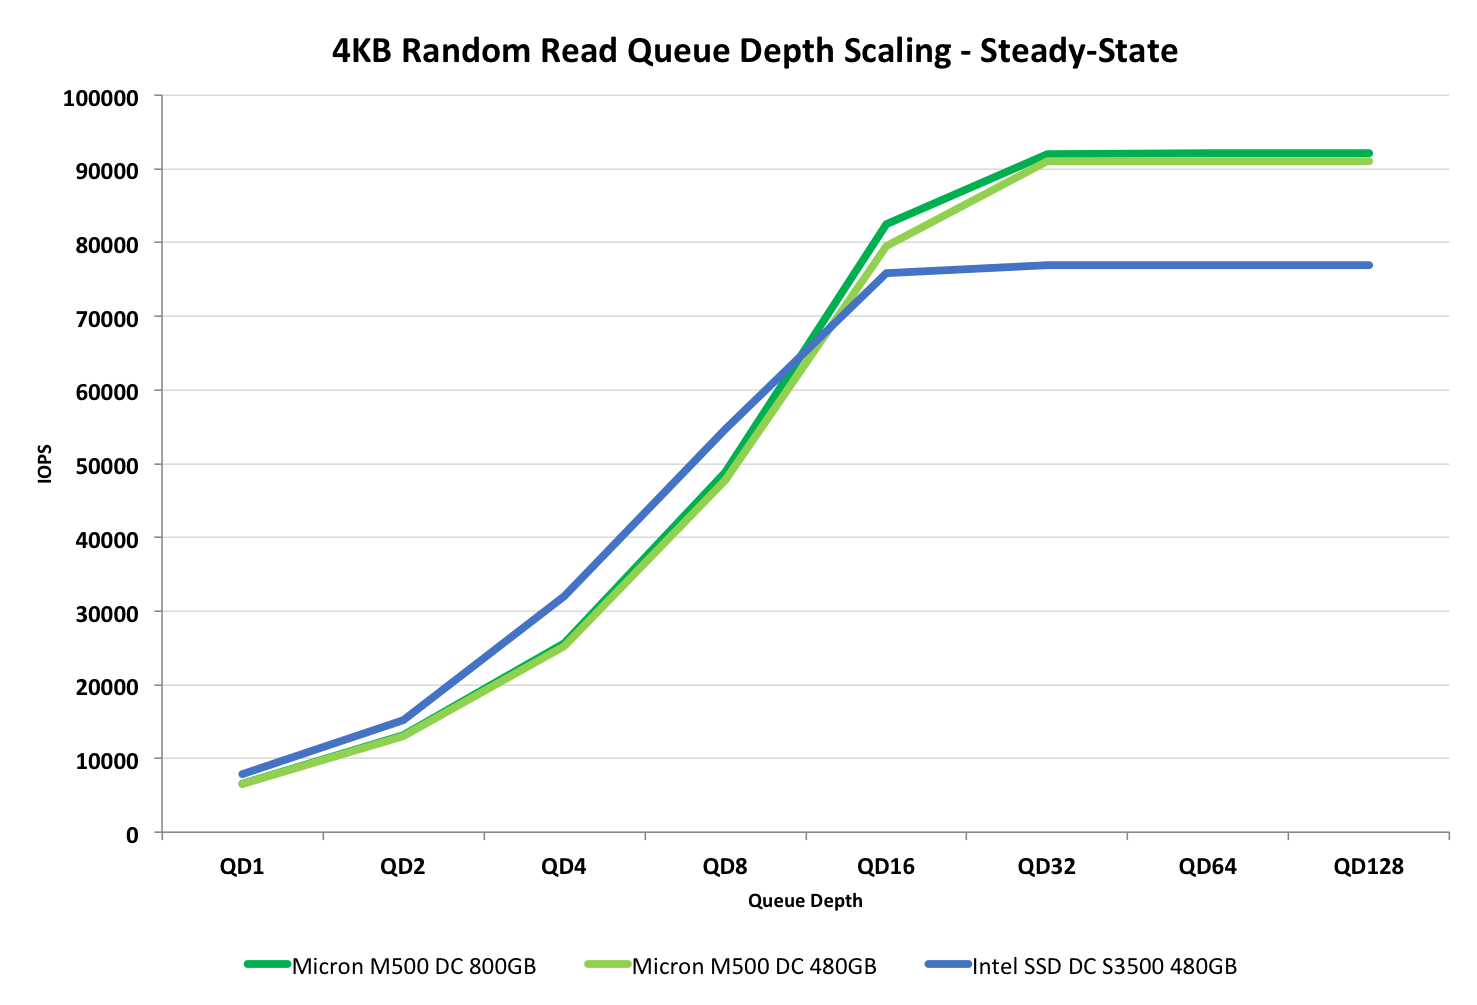
Random read performance, on the other hand, behaves a bit differently. As steady-state doesn't really affect read performance, the performance scales all the way to 90K IOPS. The M500DC does well here and is able to beat the S3700 quite noticeably for typical enterprise workloads. The S3500 does have a small advantage at smaller queue depths but at QD16 and after, which are what matter for enterprise customers, the M500DC takes the lead.
4KB Random 70% Read - 30% Write Performance
Typically no workload is 100% read or write, so to give a perspective of a mixed workload we are now including a 4KB random test with 70% read and 30% write commands. The LBA space is still 100% and the IOs are fully random, something which is also common for enterprise workloads.
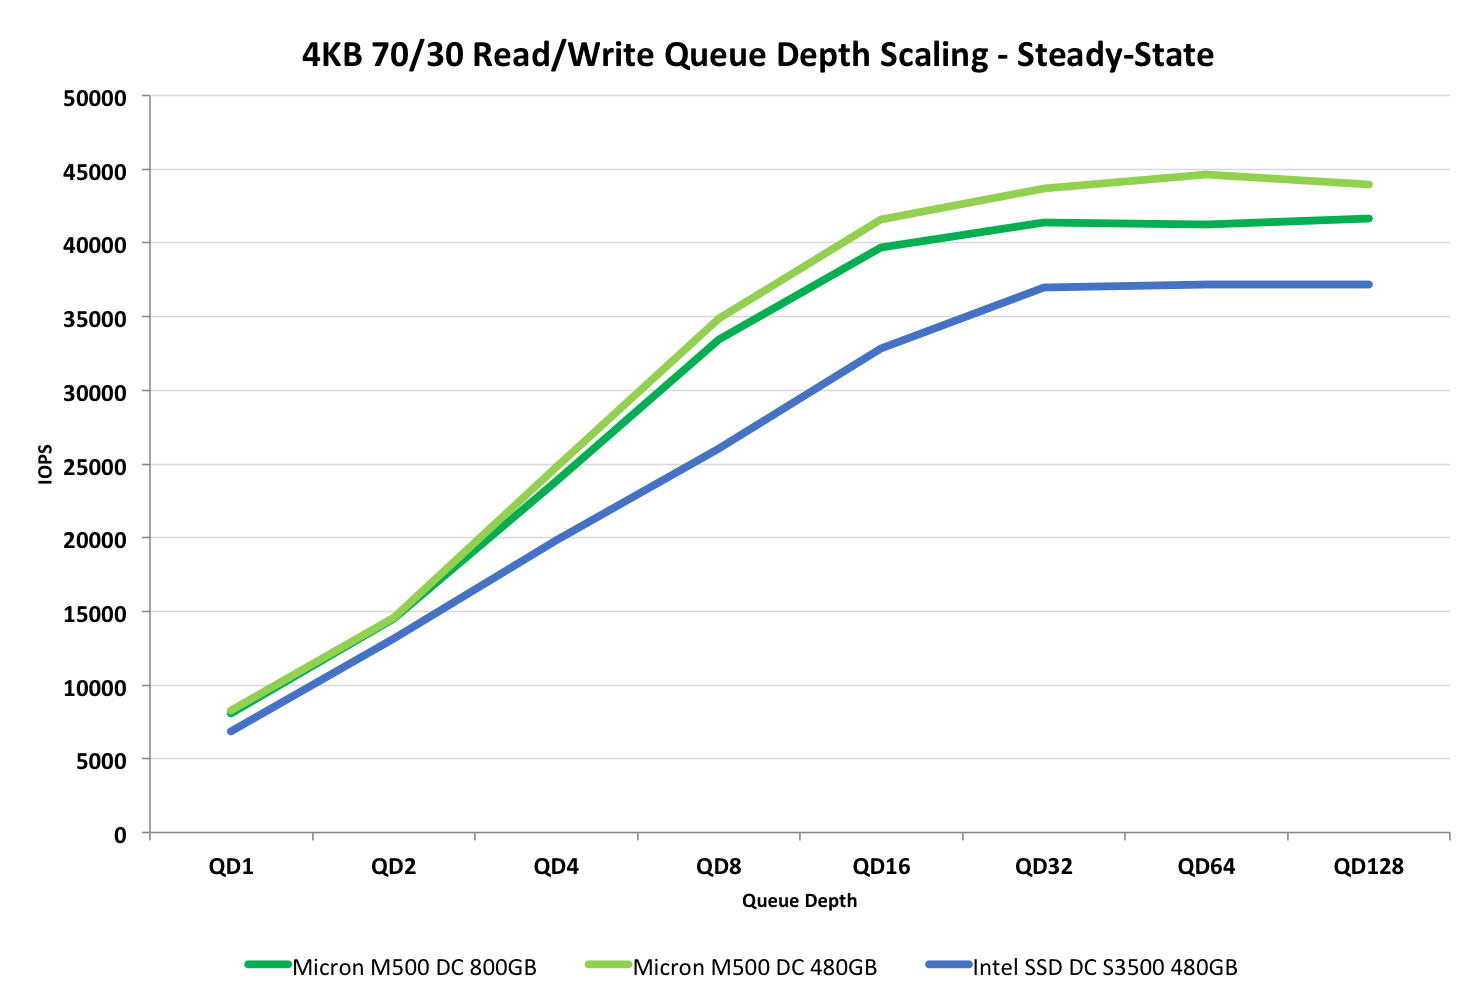
Once again the M500DC beats the DC S3500, which is mostly due to its superior random write performance. This is also the only workload where scaling happens up to queue depth of 32.
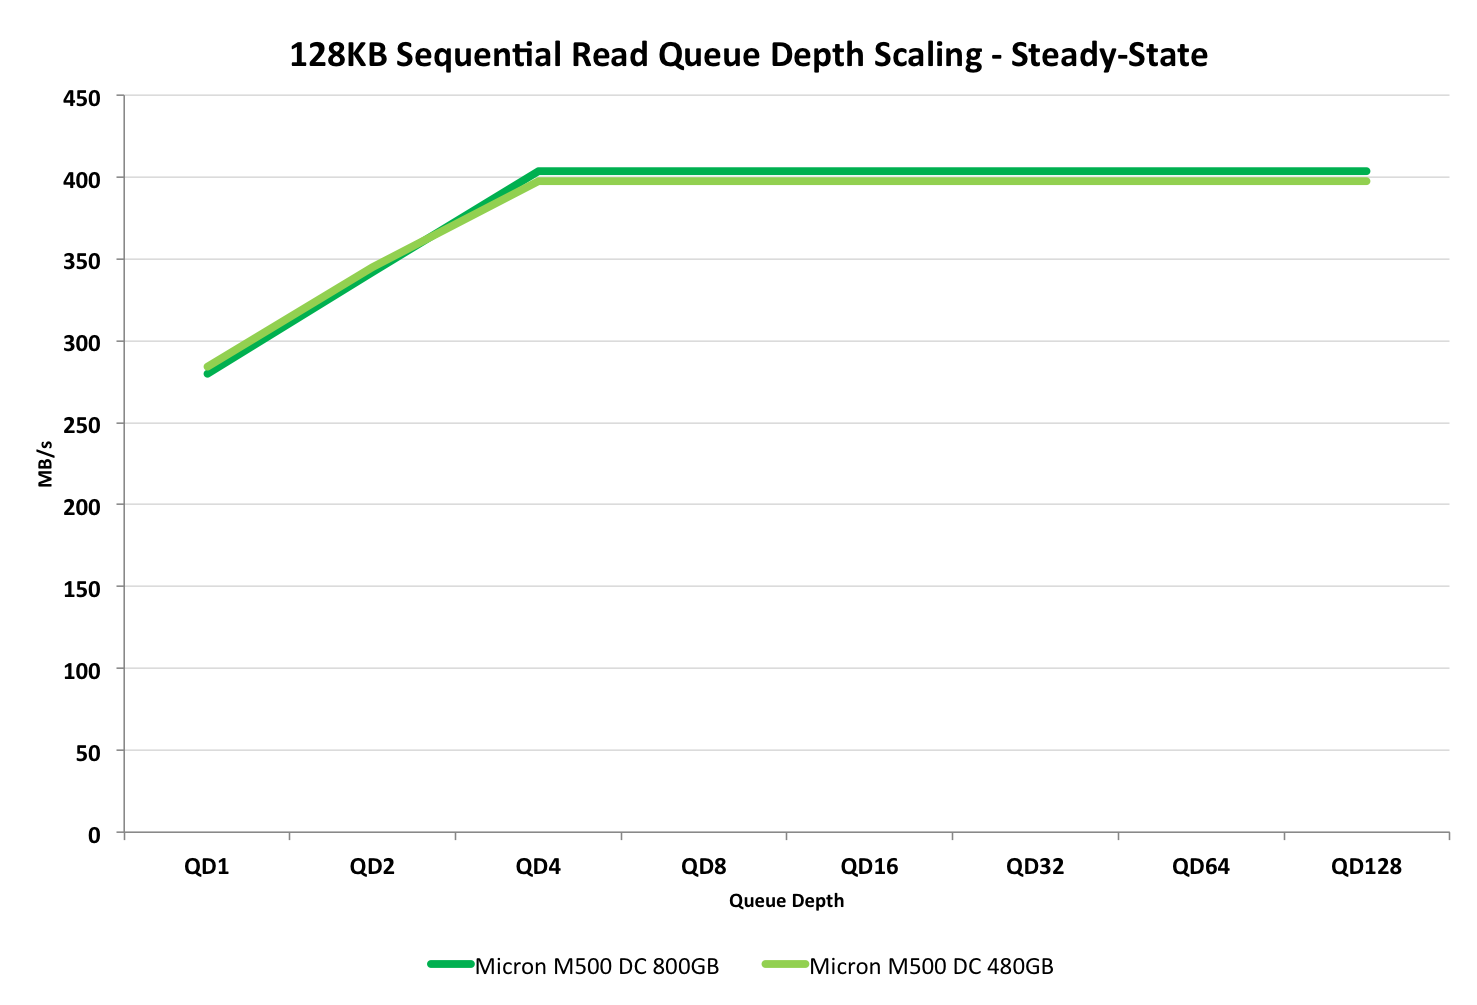
128KB Sequential Performance
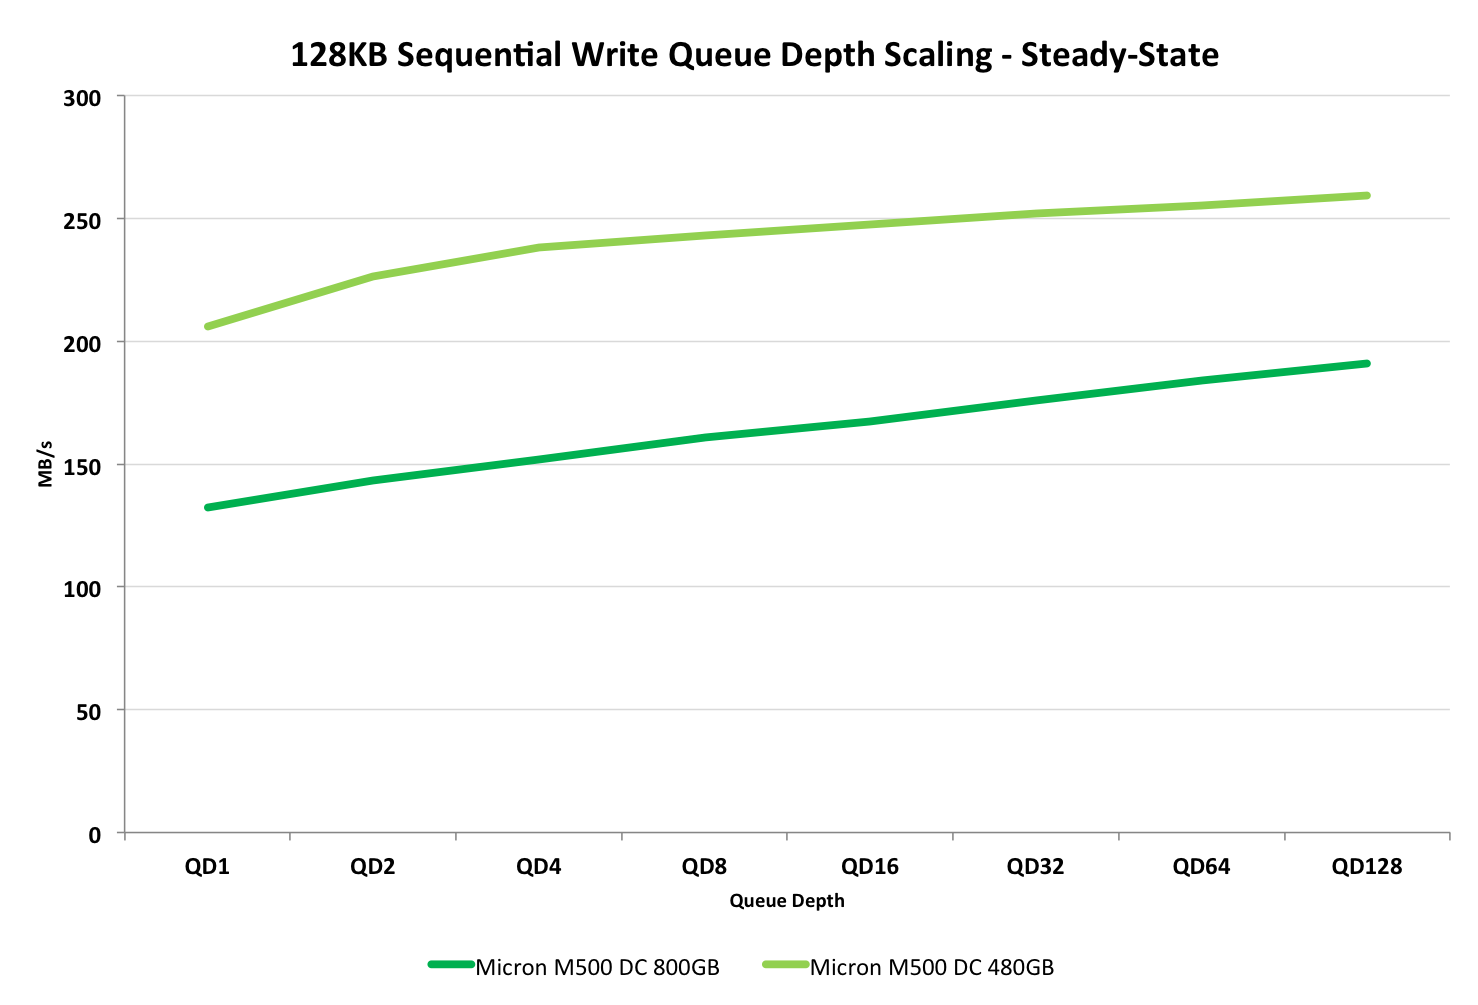
Due to lack of time, I unfortunately don't have results for the sequential performance of the DC S3500. However, the tests still provide a look into the M500DC even though the graphs lack a comparison point.
The 480GB M500DC is again significantly faster than the 800GB model thanks to the added over-provisioning. Bear in mind that these are steady-state figures, which is why the performance may seem a bit slow compared to what we usually see in benchmarks.
In terms of sequential read performance, on the other hand, the drives appear equal.


37 Comments
View All Comments
Solid State Brain - Tuesday, April 22, 2014 - link
Enterprise SSDs usually have their endurance rated at 3 months of residual data retention capability, vs 1 year for consumer models. Since data retention time decreases with NAND wear, this allows manufacturers to claim almost "for free" a higher endurance than what the P/E limit for consumer NAND memory would suggest, even though it might be the exact same memory (but different requirements).Most likely, the rated endurance for these drives is at a much higher number of P/E cycles than 3000.
Kristian Vättö - Tuesday, April 22, 2014 - link
"Most likely, the rated endurance for these drives is at a much higher number of P/E cycles than 3000."I don't think that is necessarily the case. If you look at my calculations on the "Endurance Ratings" page, the combined WLF and WAF is already only 1.24x when using the raw NAND capacity to calculate the endurance at 3,000 P/E cycles. 1.24x is excellent, so I find it hard to believe that the NAND would be rated at higher than 3,000 cycles as the combined WLF and WAF would essentially be about 1.00 in that case (which is basically impossible without compression). Also, Micron specifically said that this is a 3,000 P/E cycle part.
Solid State Brain - Tuesday, April 22, 2014 - link
As the endurance rating for enterprise drives is usually intended for a typical steady random workload (and no trim to help), the write amplification factor should be higher than the rather low value you used for your calculation. You can see that endurance figures (not just in this case, but most other other enterprise drives as well) start make more sense when actual P/E cycles for that usage/application are higher than their consumer counterparts.Here's a prominent example. You could try the same calculation here. In this specification sheet for 2013 Samsung enterprise drives, which includes a model with TLC NAND, it's dead obvious that the rated P/E cycles limit of consumer drives (unofficially, rated 1000 cycles) doesn't apply for them, even though for the low end models they're most certainly using the same memory. You never really see a fixed P/E cycles limit for enterprise drives as in the end is the TBW figure that counts and the shorter data retention requirement for them helps boosting that even though there might actually not be any hardware difference at all.
http://www.samsung.com/global/business/semiconduct...
apudapus - Tuesday, April 22, 2014 - link
The specs you linked definitely show 1000 P/E cycles for all the NAND on all the drives, TLC and MLC. I used this formula: Total Bytes Written Allowed = NAND P/E cycles * Total Bytes Written per DayEnterprise drives have lower data retention requirements because in the enterprise space, drives will be read and written to more frequently and will not be powered off for extended periods of time. Consumer drives on the other hand can have a lots of down time.
Solid State Brain - Tuesday, April 22, 2014 - link
PM843, TLC NAND rated 1000 P/E cycles on the consumer version. Let's take the 120GB model as an example.Endurance with 100% sequential workloads: 207 TB
1000 P/E (NAND life @ 1 year of data retention, on the consumer version) * 128 GiB (physical NAND capacity) = 128000 GB = 125 TiB. This drive doesn't make use of data compression. With sequential workloads the best case write amplification would therefore be 1.0x. To reach the claimed 207 TiB of terabytes written of endurance, the NAND memory on this drive would need at the very least to endure 1000/125*207 = 1656 P/E cycles, again assuming the best case write amplification factor. One can expect this to be at least around 1.15-1.20x under real world scenarios, which would bring this figure to about 1900-2000 P/E cycles.
SM843, the enterprise version of the 840 Pro with 3000 P/E cycles MLC NAND. Again, let's take the 120GB version for reference.
Stated endurance with 100% sequential workloads: 1 PB
128 GiB physical capacity * 3000 P/E cycles = 375 TiB
Actual P/E cycles needed for 1 PB at 1.0x write amplification: 3000 * 1024/375 = 8192
Kristian Vättö - Wednesday, April 23, 2014 - link
Like I said, ultimately it's impossible to figure out where exactly the endurance is coming from. It's likely that the NAND could be rated higher thanks to the looser retention requirements (3 months vs 1 year) in the enterprise space but then again, figuring out the exact P/E cycle count isn't easy because we don't know the write amplification.Solid State Brain - Wednesday, April 23, 2014 - link
If you have spare time and still have the drives you could try applying a standard sustained 4kB random load for an extended period of time to figure out what the write amplification for these drives with that usage is. Marvell-based SSDs usually provide, in a way or another, both NAND writes and Host writes among their monitoring attributes, and with these data it's pretty straightforward to calculate it. Given the large OP area, I predict it will end up being somewhere around 2.5x.Kristian Vättö - Wednesday, April 23, 2014 - link
I still have the drives but there are other products in the review queue. I'll see what I can do -- the process is rather simple as you outlined I've done some similar testing in the past too.Kristian Vättö - Wednesday, April 23, 2014 - link
*and I've done similar testing in the past too.(Yes, we need an edit button)
apudapus - Wednesday, April 23, 2014 - link
OIC. My best guess is that the voltage thresholding (their ARM/OR) extends the life of the NAND.