Micron M500DC (480GB & 800GB) Review
by Kristian Vättö on April 22, 2014 2:35 PM ESTPerformance Consistency
Performance consistency tells us a lot about the architecture of these SSDs and how they handle internal defragmentation. The reason we don’t have consistent IO latency with SSDs is because inevitably all controllers have to do some amount of defragmentation or garbage collection in order to continue operating at high speeds. When and how an SSD decides to run its defrag or cleanup routines directly impacts the user experience as inconsistent performance results in application slowdowns.
To test IO consistency, we fill a secure erased SSD with sequential data to ensure that all user accessible LBAs have data associated with them. Next we kick off a 4KB random write workload across all LBAs at a queue depth of 32 using incompressible data. The test is run for just over half an hour and we record instantaneous IOPS every second.
We are also testing drives with added over-provisioning by limiting the LBA range. This gives us a look into the drive’s behavior with varying levels of empty space, which is frankly a more realistic approach for client workloads.
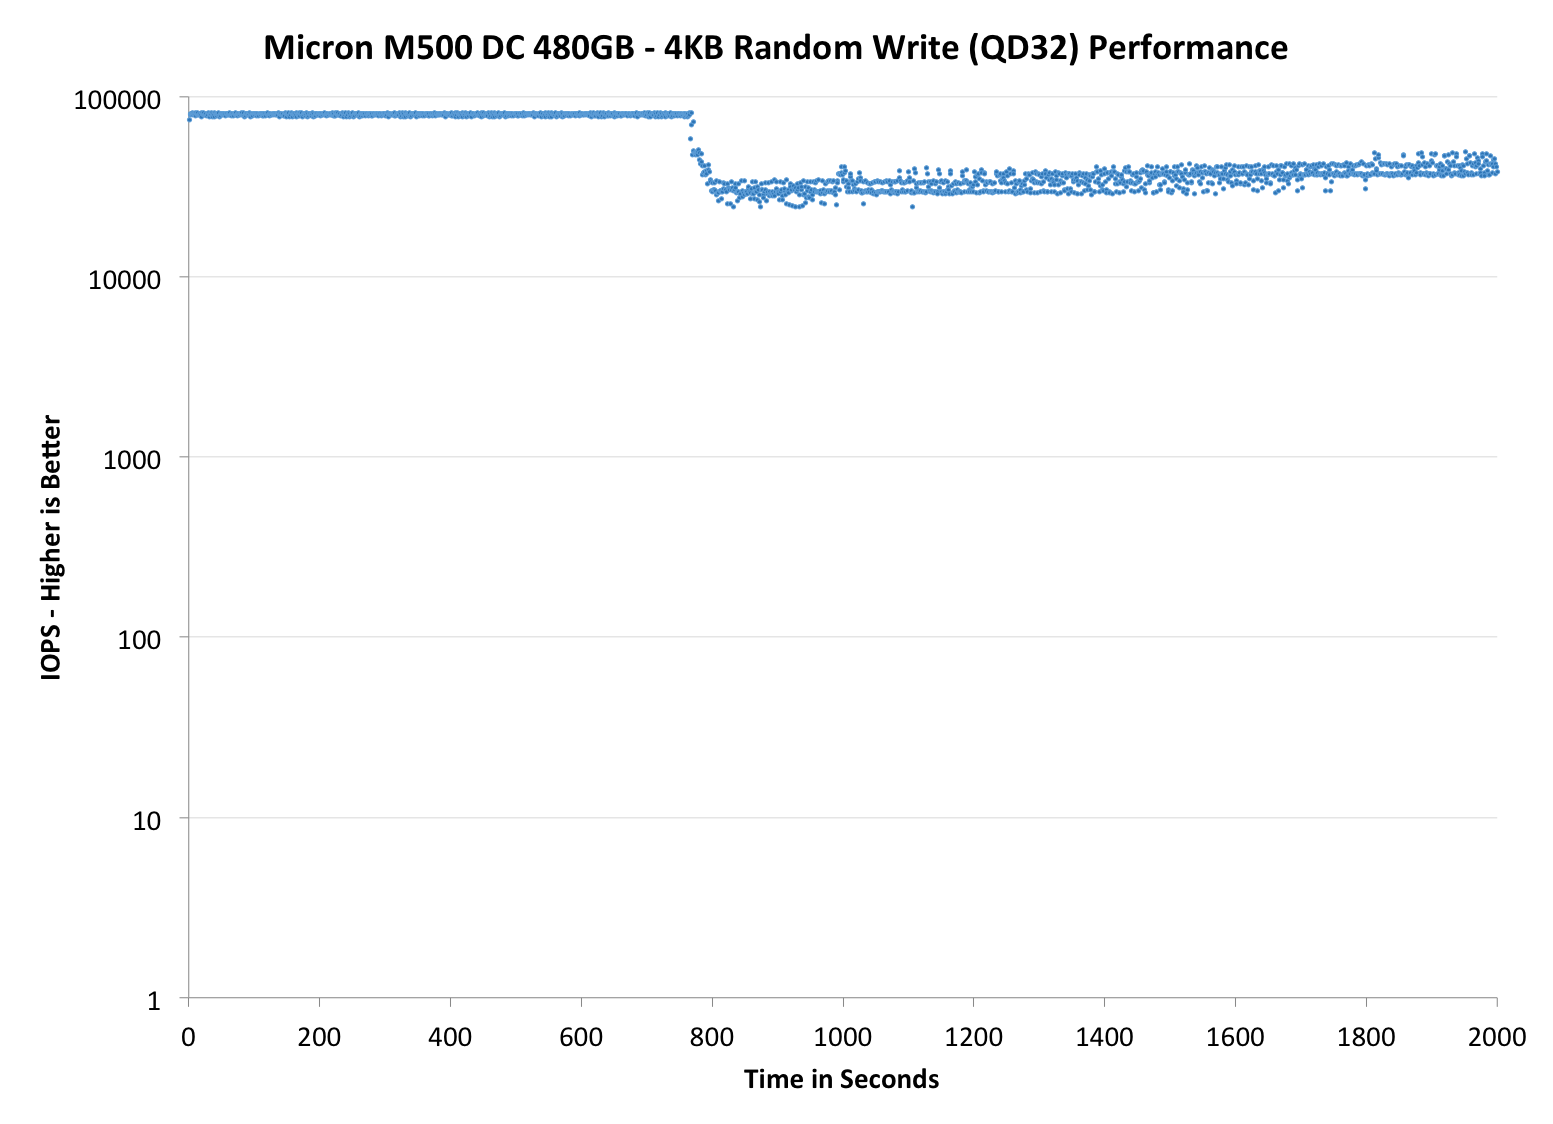
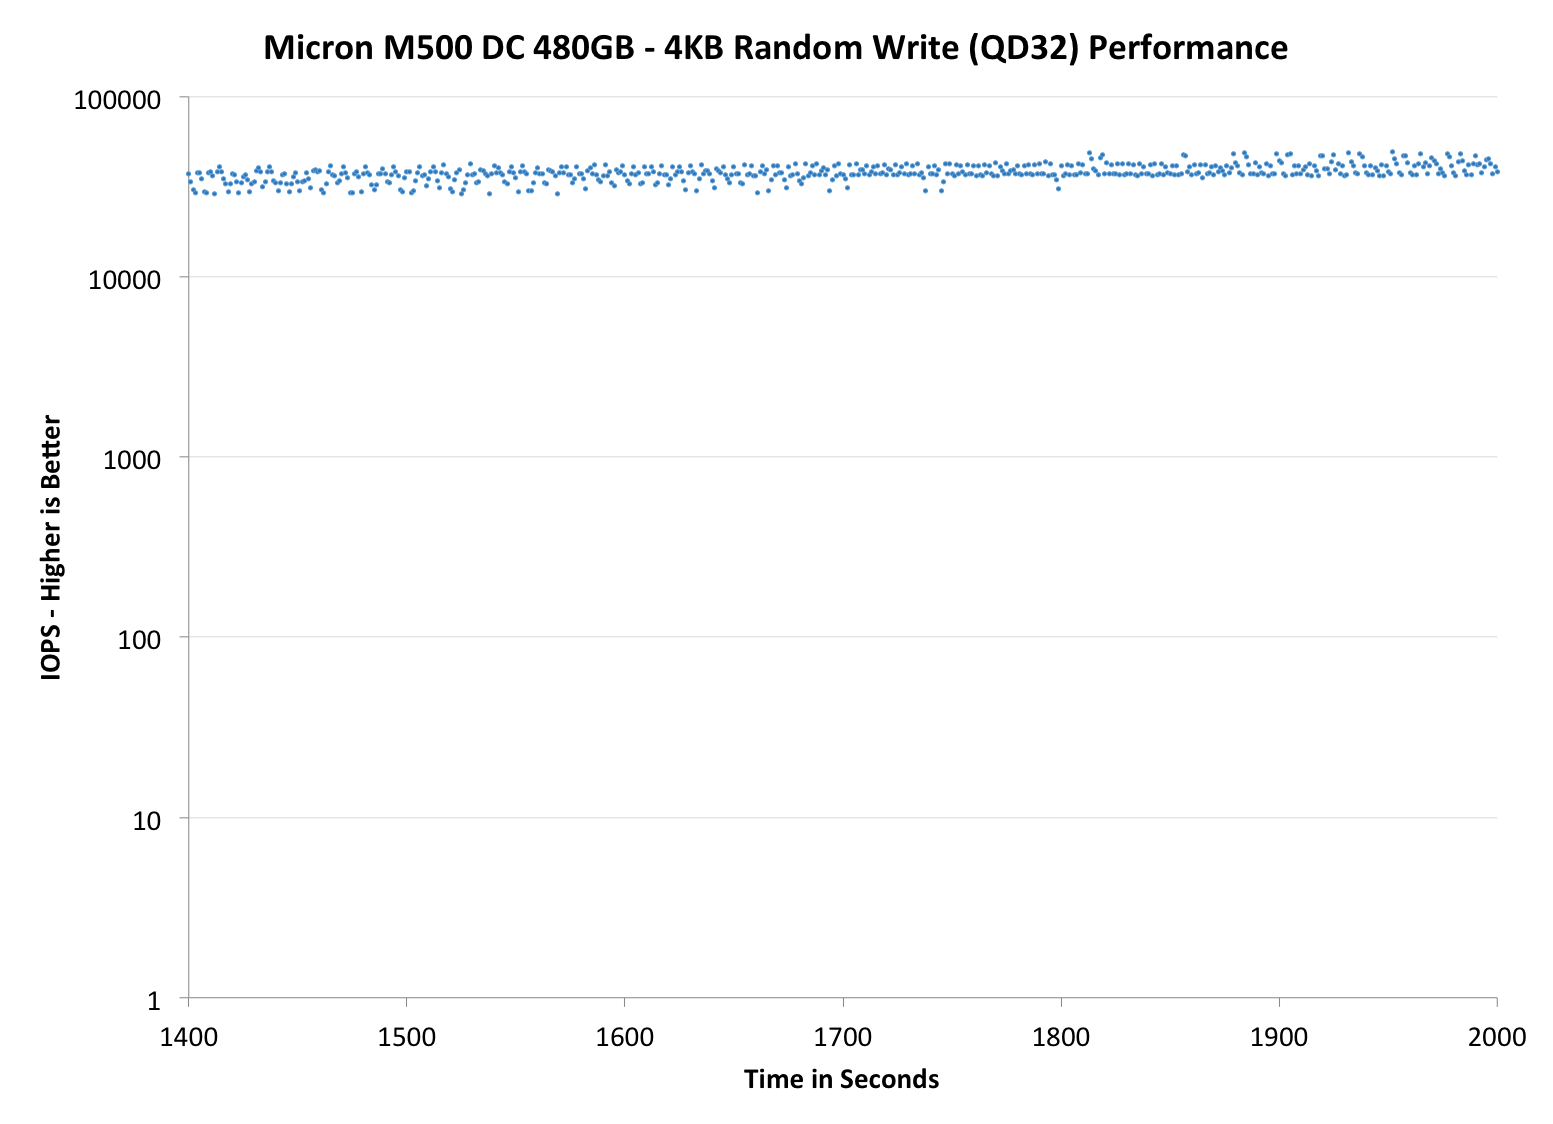
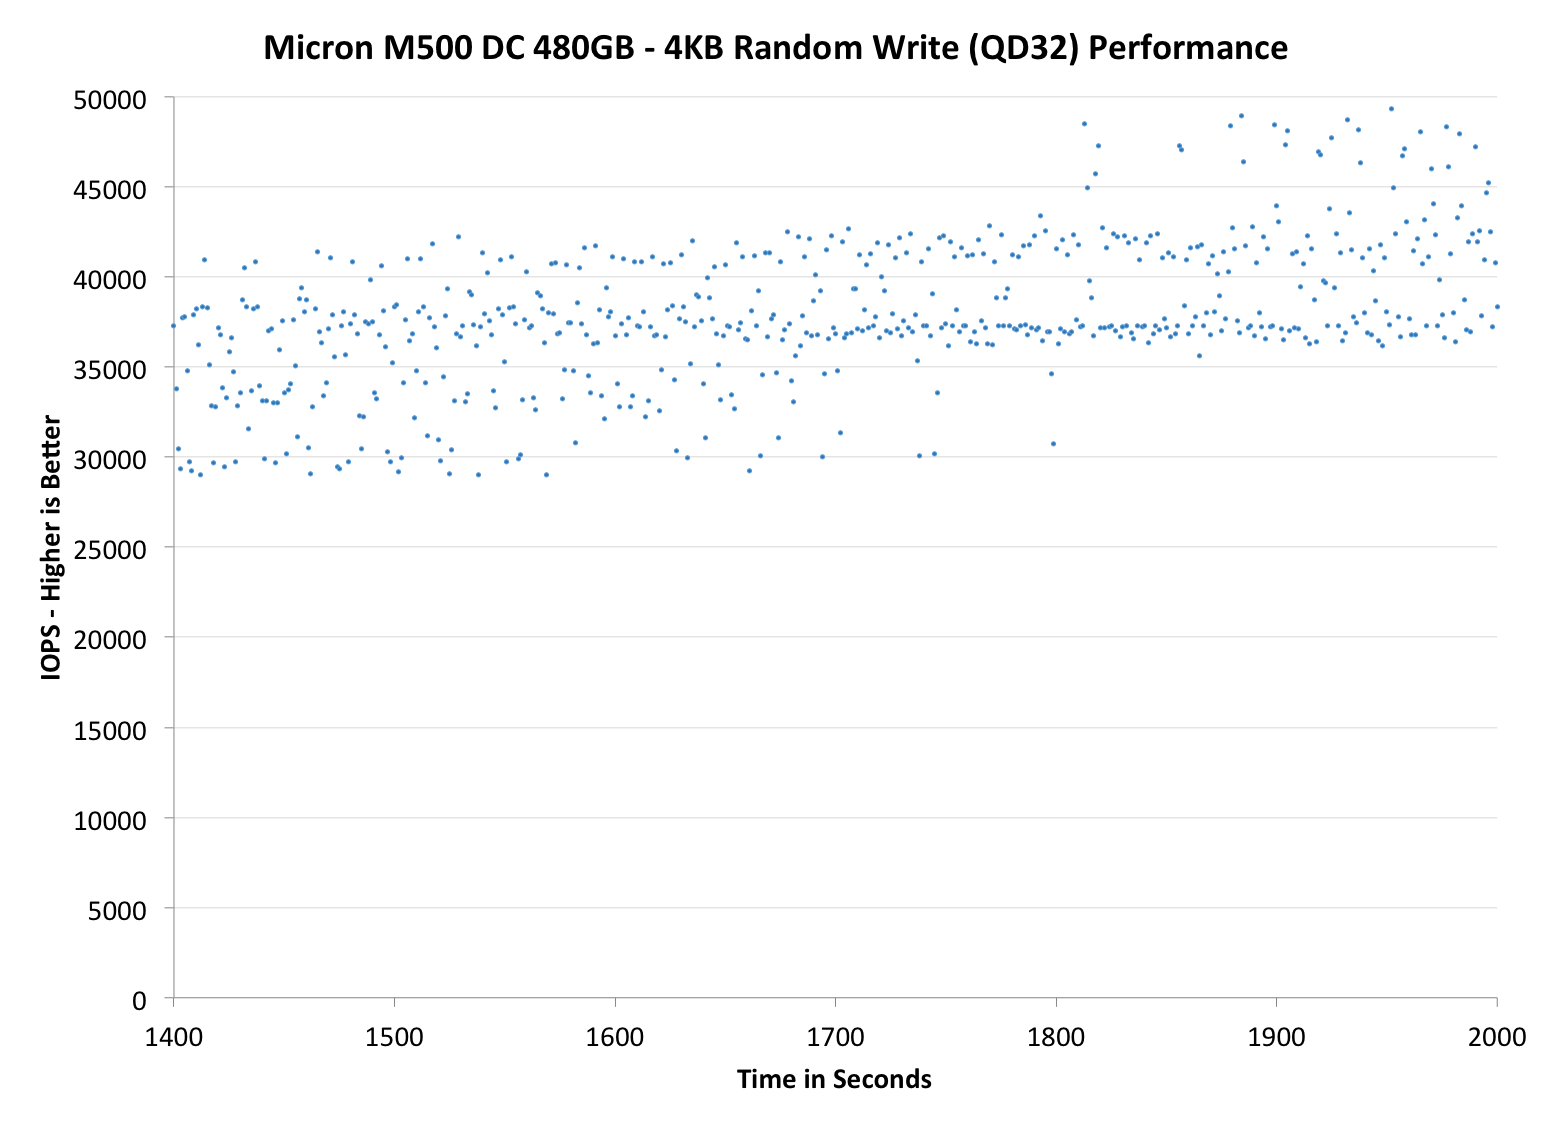
Each of the three graphs has its own purpose. The first one is of the whole duration of the test in log scale. The second and third one zoom into the beginning of steady-state operation (t=1400s) but on different scales: the second one uses log scale for easy comparison whereas the third one uses linear scale for better visualization of differences between drives. Click the buttons below each graph to switch the source data.
For more detailed description of the test and why performance consistency matters, read our original Intel SSD DC S3700 article.
 |
|||||||||
| Micron M500DC | Crucial M500 | Micron P400e | Micron P400m | Intel SSD DC S3500 | |||||
| Default |
|
||||||||
As you would expect with such hefty over-provisioning, the IO consistency is excellent. The 480GB model manages around 40K IOPS at steady-state, which is certainly one of the highest we have tested. (For the record, the Intel DC S3700 does about 33K but unfortunately there wasn't room in the table to include it.) The 800GB version doesn't do as well given its smaller over-provisioning percentage but it's relatively competitive with the 200GB P400m, which has 336GiB of NAND onboard (that's 44.6% total over-provisioning versus 27.2% in the 800GB M500DC). Compared with the P400m, the M500DC is, after all, a nice upgrade because it's able to improve IO consistency without using more over-provisioning to do that.
 |
|||||||||
| Micron M500DC | Crucial M500 | Micron P400e | Micron P400m | Intel SSD DC S3500 | |||||
| Default |
|
||||||||
 |
|||||||||
| Micron M500DC | Crucial M500 | Micron P400e | Micron P400m | Intel SSD DC S3500 | |||||
|
Default |
|
||||||||
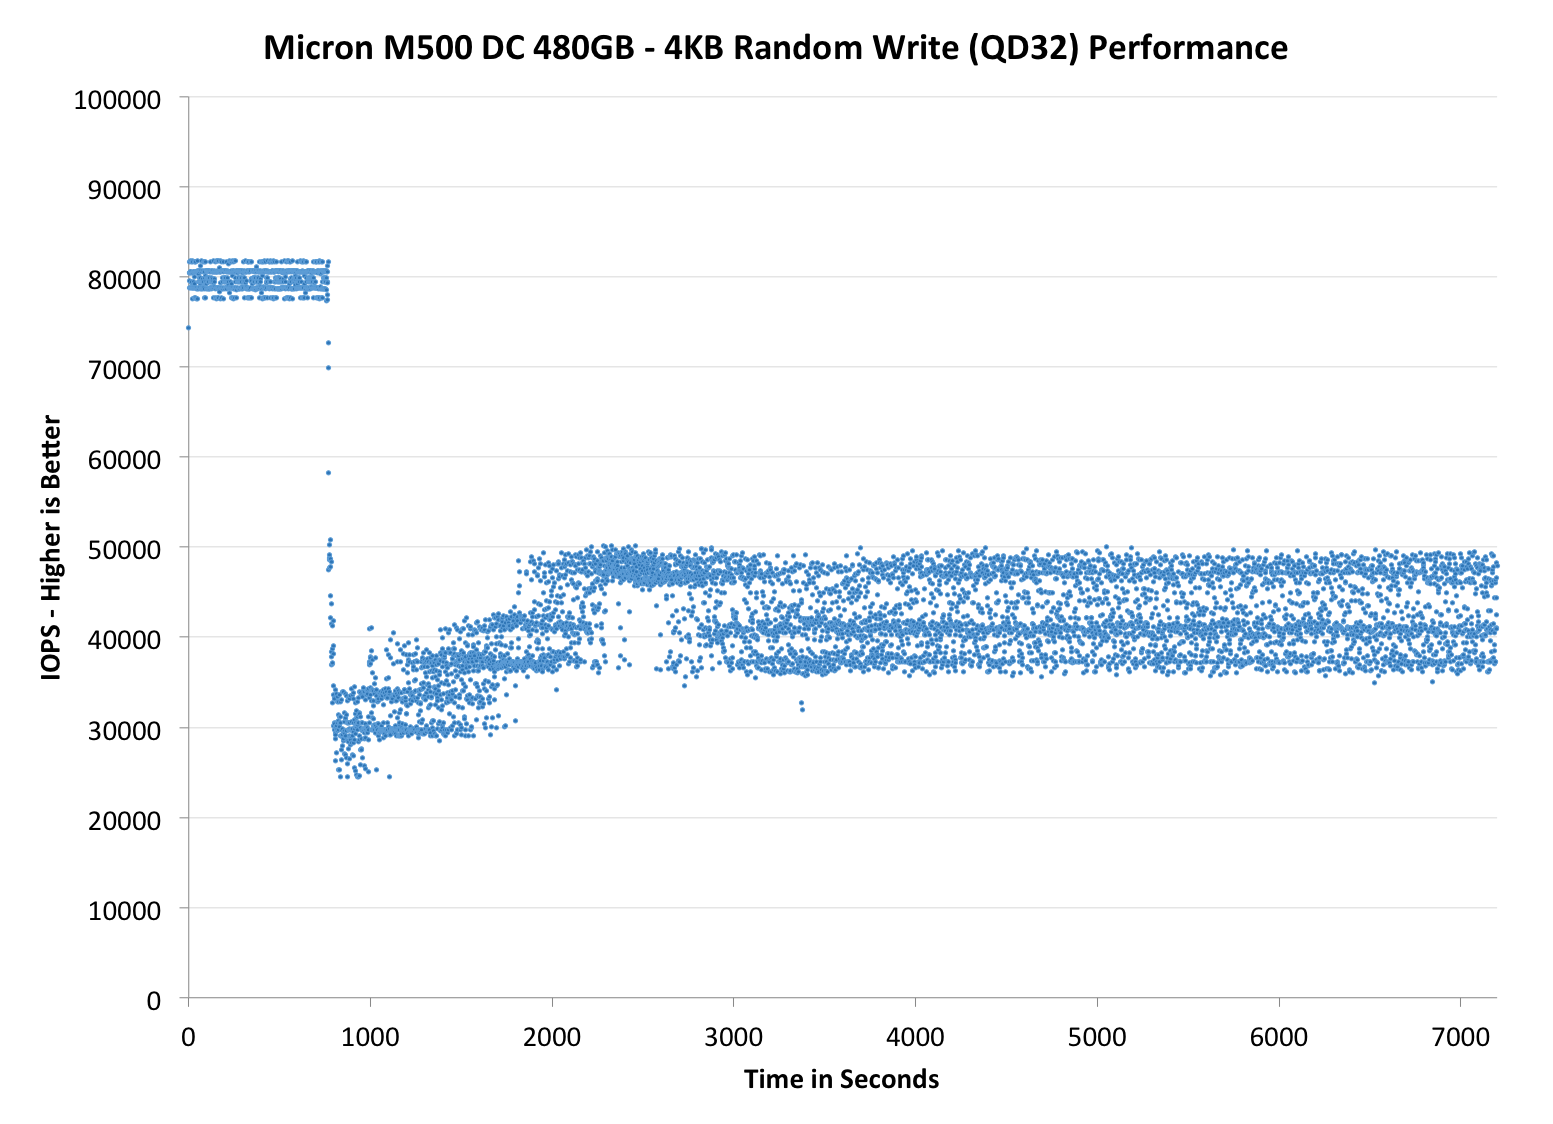
In addition to our regular performance consistency graphs, I decided to include two additional graphs that test the IO consistency over a longer period of time. For client drives, 2000 seconds is generally enough to show steady-state behavior but enterprise SSDs tend to have more over-provisioning and hence require a longer time to reach steady-state. Instead of running the test for 2000 seconds, I extended the run to 7200 seconds (i.e. two hours) while keeping everything else the same. I only have results for the M500DC drives right now, but let's see if anything changes with a longer test cycle:
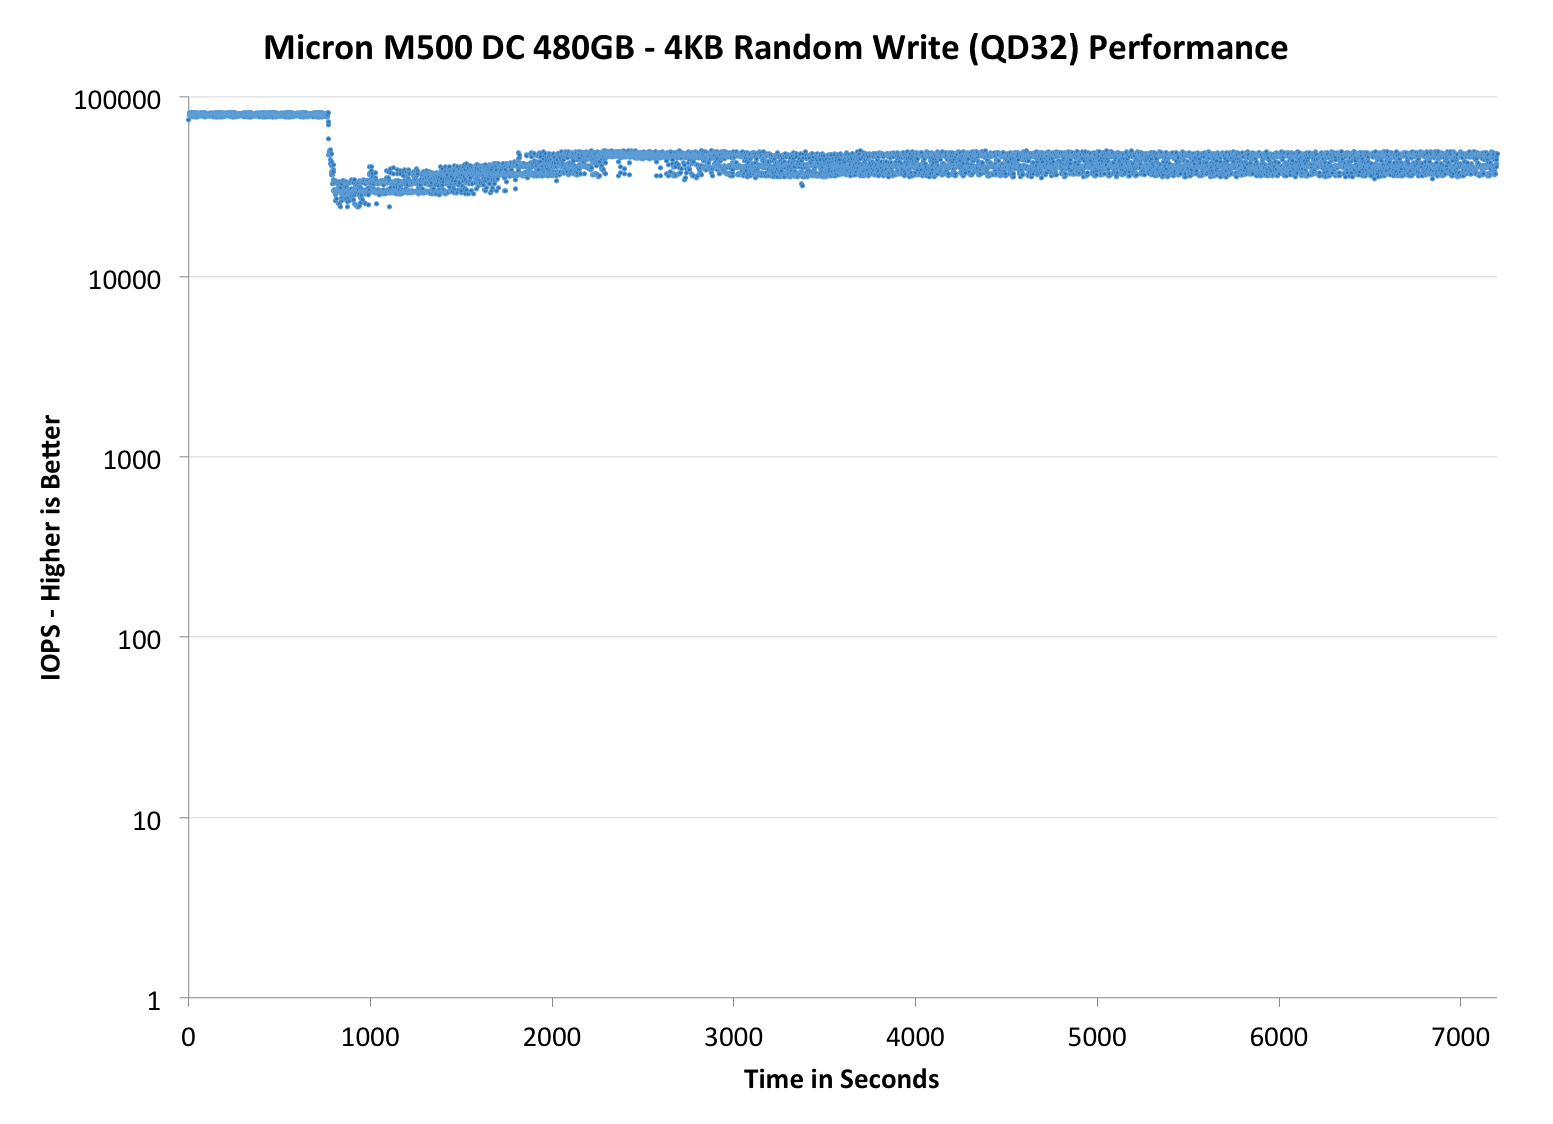
As you can see, neither of the drives show steady behavior right after 2000 seconds. In fact, it looks as though the initial trigger of data reordering drops performance and then the M500DC drives recover somewhat around the 3000 second mark, though the different amount of overprovisioning means they don't look all that similar. Unfortunately I don't have any results for other drives at this point but I'll be sure to test more drives before the next review to give you a better picture ot the M500DC's position in the market.


37 Comments
View All Comments
Solid State Brain - Tuesday, April 22, 2014 - link
Enterprise SSDs usually have their endurance rated at 3 months of residual data retention capability, vs 1 year for consumer models. Since data retention time decreases with NAND wear, this allows manufacturers to claim almost "for free" a higher endurance than what the P/E limit for consumer NAND memory would suggest, even though it might be the exact same memory (but different requirements).Most likely, the rated endurance for these drives is at a much higher number of P/E cycles than 3000.
Kristian Vättö - Tuesday, April 22, 2014 - link
"Most likely, the rated endurance for these drives is at a much higher number of P/E cycles than 3000."I don't think that is necessarily the case. If you look at my calculations on the "Endurance Ratings" page, the combined WLF and WAF is already only 1.24x when using the raw NAND capacity to calculate the endurance at 3,000 P/E cycles. 1.24x is excellent, so I find it hard to believe that the NAND would be rated at higher than 3,000 cycles as the combined WLF and WAF would essentially be about 1.00 in that case (which is basically impossible without compression). Also, Micron specifically said that this is a 3,000 P/E cycle part.
Solid State Brain - Tuesday, April 22, 2014 - link
As the endurance rating for enterprise drives is usually intended for a typical steady random workload (and no trim to help), the write amplification factor should be higher than the rather low value you used for your calculation. You can see that endurance figures (not just in this case, but most other other enterprise drives as well) start make more sense when actual P/E cycles for that usage/application are higher than their consumer counterparts.Here's a prominent example. You could try the same calculation here. In this specification sheet for 2013 Samsung enterprise drives, which includes a model with TLC NAND, it's dead obvious that the rated P/E cycles limit of consumer drives (unofficially, rated 1000 cycles) doesn't apply for them, even though for the low end models they're most certainly using the same memory. You never really see a fixed P/E cycles limit for enterprise drives as in the end is the TBW figure that counts and the shorter data retention requirement for them helps boosting that even though there might actually not be any hardware difference at all.
http://www.samsung.com/global/business/semiconduct...
apudapus - Tuesday, April 22, 2014 - link
The specs you linked definitely show 1000 P/E cycles for all the NAND on all the drives, TLC and MLC. I used this formula: Total Bytes Written Allowed = NAND P/E cycles * Total Bytes Written per DayEnterprise drives have lower data retention requirements because in the enterprise space, drives will be read and written to more frequently and will not be powered off for extended periods of time. Consumer drives on the other hand can have a lots of down time.
Solid State Brain - Tuesday, April 22, 2014 - link
PM843, TLC NAND rated 1000 P/E cycles on the consumer version. Let's take the 120GB model as an example.Endurance with 100% sequential workloads: 207 TB
1000 P/E (NAND life @ 1 year of data retention, on the consumer version) * 128 GiB (physical NAND capacity) = 128000 GB = 125 TiB. This drive doesn't make use of data compression. With sequential workloads the best case write amplification would therefore be 1.0x. To reach the claimed 207 TiB of terabytes written of endurance, the NAND memory on this drive would need at the very least to endure 1000/125*207 = 1656 P/E cycles, again assuming the best case write amplification factor. One can expect this to be at least around 1.15-1.20x under real world scenarios, which would bring this figure to about 1900-2000 P/E cycles.
SM843, the enterprise version of the 840 Pro with 3000 P/E cycles MLC NAND. Again, let's take the 120GB version for reference.
Stated endurance with 100% sequential workloads: 1 PB
128 GiB physical capacity * 3000 P/E cycles = 375 TiB
Actual P/E cycles needed for 1 PB at 1.0x write amplification: 3000 * 1024/375 = 8192
Kristian Vättö - Wednesday, April 23, 2014 - link
Like I said, ultimately it's impossible to figure out where exactly the endurance is coming from. It's likely that the NAND could be rated higher thanks to the looser retention requirements (3 months vs 1 year) in the enterprise space but then again, figuring out the exact P/E cycle count isn't easy because we don't know the write amplification.Solid State Brain - Wednesday, April 23, 2014 - link
If you have spare time and still have the drives you could try applying a standard sustained 4kB random load for an extended period of time to figure out what the write amplification for these drives with that usage is. Marvell-based SSDs usually provide, in a way or another, both NAND writes and Host writes among their monitoring attributes, and with these data it's pretty straightforward to calculate it. Given the large OP area, I predict it will end up being somewhere around 2.5x.Kristian Vättö - Wednesday, April 23, 2014 - link
I still have the drives but there are other products in the review queue. I'll see what I can do -- the process is rather simple as you outlined I've done some similar testing in the past too.Kristian Vättö - Wednesday, April 23, 2014 - link
*and I've done similar testing in the past too.(Yes, we need an edit button)
apudapus - Wednesday, April 23, 2014 - link
OIC. My best guess is that the voltage thresholding (their ARM/OR) extends the life of the NAND.