Intel SSD DC S3500 Review (480GB): Part 1
by Anand Lal Shimpi on June 11, 2013 6:10 PM EST- Posted in
- Storage
- IT Computing
- SSDs
- Intel
- Datacenter
- Enterprise
Random & Sequential IO Performance
Similar to our other Enterprise Iometer tests, queue depths are much higher in our Iometer benchmarks. To measure sequential performance I ran a 1 minute long 128KB sequential test over the entire span of the drive at a queue depth of 32. For random performance, I ran a 3 minute long 4KB random read test over the entire span of the drive at a queue depth of 32. Random write performance was measured at steady state (QD32), which varies depending on capacity and other factors. The results reported are in average MB/s over the entire test length.
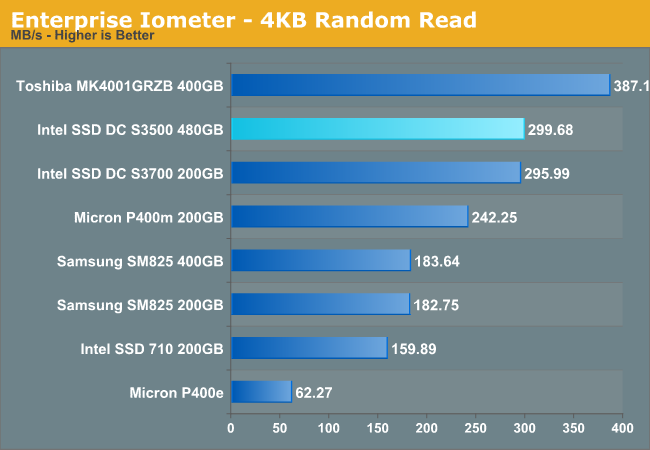
Random read performance is just excellent. The S3500 gives up nothing compared to the S3700 and ends up being one of the fastest enterprise drives we've tested.
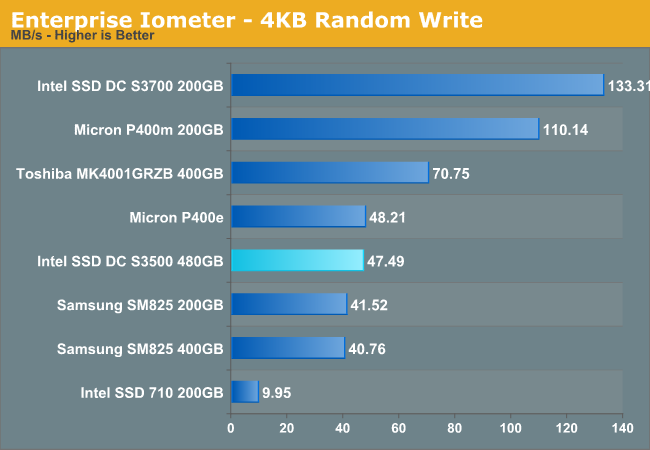
Random write performance takes a big hit compared to the S3700. At 47MB/s, the S3500 isn't bad but it's not class leading like the S3700.
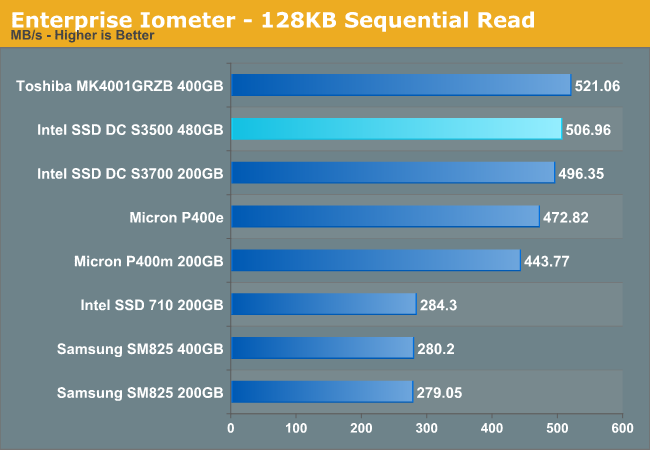
Sequential read speed is limited by 6Gbps SATA, and the S3500 has no issues hitting that limit given the number of NAND die inside the 480GB model. It's not until you get down to the 160GB version that performance will drop below 500MB/s.
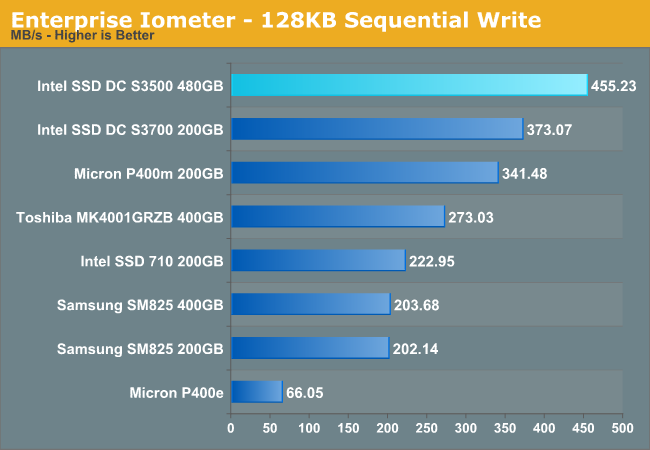
Sequential write performance is substantially better on the S3500, making this drive even better for large sequential caching applications.


54 Comments
View All Comments
ShieTar - Wednesday, June 12, 2013 - link
I think the metric is supposed to show that you need a dedicated drive per VM with mechanical HDDs, but that one of these SSDs can support and not slow down 12 VMs by itself. Having 12 VMs access the same physical HDD can drive access times into not-funny territory.The 20GB per VM can be enough if have a specific kernel and very little software. Think about a "dedicated" Web-Server. Granted, the comparison assumes a quiet specific usage scenario, but knowing Intel they probably did go out and retrieve that scenario from an actual commercial user. So it is a valid comparison for somebody, if maybe not the most convincing one to a broad audience.
Death666Angel - Wednesday, June 12, 2013 - link
Read the conclusion page. That just refers to the fact that those 2 setups have the same random IO performance. Nothing more, nothing less.FunBunny2 - Wednesday, June 12, 2013 - link
Well, there's that other vector to consider: if you're enamoured of sequential VSAM type applications, then you'd need all that HDD footprint. OTOH, if you're into 3NF RDBMS, you'd need substantially less. So, SSD reduces footprint and speeds up the access you do. Kind of a win-win.jimhsu - Wednesday, June 12, 2013 - link
Firstly, the 500 SAS drives are almost certainly short-stroked (otherwise, how do you sustain 200 IOPS, even on 15K drives). That cuts capacity by 2x at least. Secondly, the large majority of web service/database/enterprise apps are IO-limited, not storage-limited, hence all that TB is basically worthless if you can't get data in and out fast enough. For certain applications though (I'm thinking image/video storage for one), obviously you'd use a HDD array. But their comparison metric is valid.rs2 - Wednesday, June 12, 2013 - link
That doesn't mean it's not also confusing. The primary purpose of a "SW SAN Solution" is storage, not IOPS, so one SAN is not comparable to another SAN unless they both offer the same storage capacity.In the specific use-case of virtualization, IOPS are generally more important than storage space. But if IOPS are what they want to compare across solutions is IOPS performance then they shouldn't label either column a "SAN".
So yes, on the one hand it's valid, but on the other it's definitely presented in a confusing way.
thomas-hrb - Wednesday, June 12, 2013 - link
It is a typical example of a vendor highlighting the statistics they want to you remember, and ignoring the ones that they hope are not important. That is the reason why technical people exist. Any fool can read and present excellent arguments for one side or the other. It is the understanding of these parameters, what they actually mean in a real world usage scenario that is the bread and butter of our industry. I don't know if this is typical for most modern SAN's. I am using a IBM v7000 (very popular SAN for IBM). But the v7000 comes with Auto Teiring which moves "hot blocks" from normal HDD Storage to SSD, thus having a solid performing random IO SSD that is consistent is essential to how this type of SAN works.Jaybus - Monday, June 17, 2013 - link
Well, but but look at it another way. You can put 120 SSDs in 20U and have 200 GB per VM using half the rack space and a tenth the power but with FAR higher performance, and for less cost.Also, the ongoing cost of power and rack space is more important. In the same 42U space you can have a 252 SSD SAN (201,600 GB) and still use less than a fifth the power and have far, far greater performance.
thomas-hrb - Wednesday, June 12, 2013 - link
They are comparing IOP's. There are a few use cases where having large amounts of storage is the main target (databases, mailbos datastores etc), but typically application servers are less than 20GB in size. Even web-servers will typically be less than 10GB (nix based) in size. Ultimately any storage system will have a blend of both technologies and have a teir'd setup where they have Traditional HDD's to cover their capacity and somewhere between 5-7% of that capacity as high performance SSD's to cover for the small subset of data blocks that are "hot" and require significant'y more IOP's. This new SSD simply gives storage professionals an added level of flexibility in their designs.androticus - Wednesday, June 12, 2013 - link
Why is "performance consistency" supposed to be so good... when the *lowest* performance number of the Seagate 600 is about the same as the *consistent* number for Intel? The *average* of the Seagate looks much higher? I could see this as an advantage if the competitor numbers also went way below Intel's consistent number, but not in this case.Lepton87 - Wednesday, June 12, 2013 - link
Compared to Seagate random write performance this doesn't look unlike a GF that delivers almost constant 60fps compared to a card that delivers 60-500fps, so what's the big deal? Cap the performance at whatever level Intel SSD delivers and you will have the same consistency, but what's the point? It only matters if the drives deliver comparable performance but one is a roller-coaster and the second is very consistent which is not the case is this comparison. Allocate more spare area to the Seagate, even 25% and it will mop the floor with this drive and price per GB will be still FAR lower. Very unimpressed with this drive, but because it's an Intel product we are talking about on Anandtech it's lauded and praised like there's no tomorrow.