Intel Alder Lake DDR5 Memory Scaling Analysis With G.Skill Trident Z5
by Gavin Bonshor on December 23, 2021 9:00 AM ESTCPU Performance, Short Form
To show the performance and scaling of DDR5 memory, we've opted for a more selective and short-form selection of benchmarks from our test suite.
Compression – WinRAR 5.90: link
Our WinRAR test from 2013 is updated to the latest version of WinRAR at the start of 2014. We compress a set of 2867 files across 320 folders totaling 1.52 GB in size – 95% of these files are small typical website files, and the rest (90% of the size) are small 30-second 720p videos.
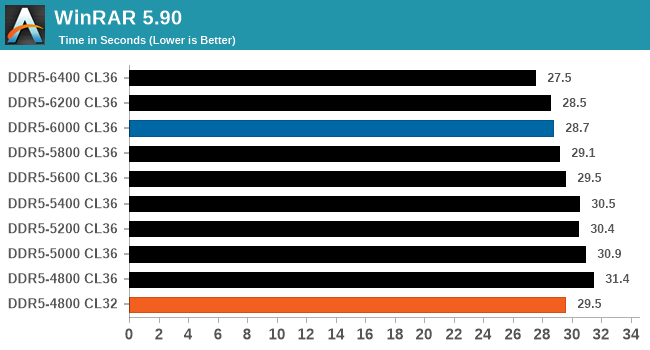
Blue is XMP; Orange is JEDEC at Low CL
In our WinRAR 5.90 benchmark, this is where we saw the most effective and conclusive levels of performance, From DDR5-4800 CL36 to DDR5-6400 CL36, we saw an impressive 14.1 % increase in throughput. Even at the DDR5-6000 CL36 XMP, there was a 9.4% jump in performance in terms of scale from the baseline.
The DDR5-4800 CL32 also provided a good uplift in performance here. It should also be noted that WinRAR 5.90 performance can be very memory dependant, and it shows in our results.
Rendering - Blender 2.79b: 3D Creation Suite
A high-profile rendering tool, Blender is open-source allowing for massive amounts of configurability, and is used by a number of high-profile animation studios worldwide. The organization recently released a Blender benchmark package, a couple of weeks after we had narrowed our Blender test for our new suite, however their test can take over an hour. For our results, we run one of the sub-tests in that suite through the command line - a standard ‘bmw27’ scene in CPU only mode, and measure the time to complete the render.
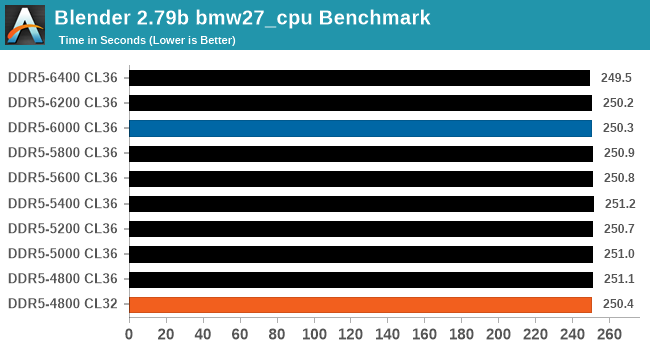
Blue is XMP; Orange is JEDEC at Low CL
In terms of scaling performance in our Blender benchmark, we saw very little variation in performance from top to bottom. Although the Trident Z5 at DDR5-6400 CL36 did perform best, it was a modest 0.6% jump in performance from our lowest result to the best.
Rendering - Cinebench R23: link
Maxon's real-world and cross-platform Cinebench test suite has been a staple in benchmarking and rendering performance for many years. Its latest installment is the R23 version, which is based on its latest 23 code which uses updated compilers. It acts as a real-world system benchmark that incorporates common tasks and rendering workloads as opposed to less diverse benchmarks which only take measurements based on certain CPU functions. Cinebench R23 can also measure both single-threaded and multi-threaded performance.
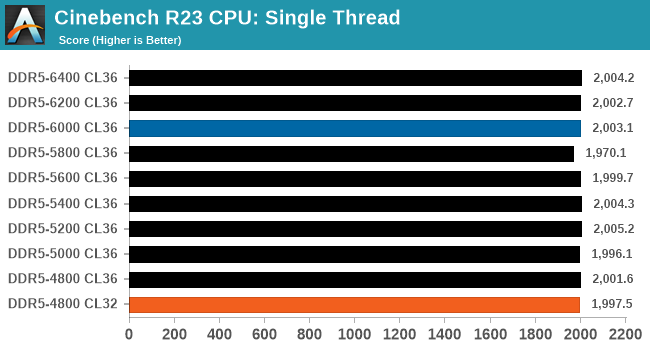
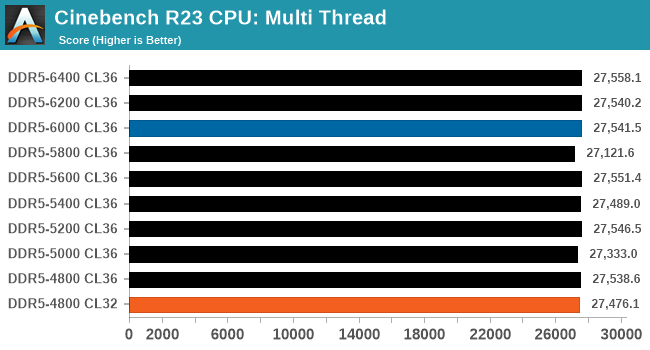
Blue is XMP; Orange is JEDEC at Low CL
Looking at performance in Cinebench R23, the results were a little sporadic, in both the single-threaded and multi-threaded testing. All of the results in the single-threaded test were within a margin of 1.8%, with the multi-threaded results within a 1.6% level of variation from top to bottom.
3DPMv2.1 – 3D Movement Algorithm Test: link
3DPM is a self-penned benchmark, taking basic 3D movement algorithms used in Brownian Motion simulations and testing them for speed. High floating point performance, MHz, and IPC win in the single thread version, whereas the multithread version has to handle the threads and loves more cores. For a brief explanation of the platform agnostic coding behind this benchmark, see my forum post here.
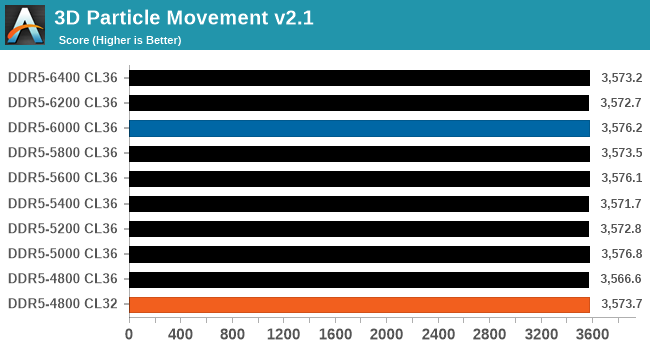
Blue is XMP; Orange is JEDEC at Low CL
Similar to what we saw in both Cinebench R23 and in our Blender benchmarks, performance in our 3DPM v2.1 testing shows little to no improvement with faster memory across the range of results. The level of variation between the best result and the worst result was around 0.3%.


82 Comments
View All Comments
TheinsanegamerN - Tuesday, December 28, 2021 - link
What is the hold up on video card reviews? I know there was that cali fire last year, but that was over a year ago now.gagegfg - Thursday, December 30, 2021 - link
The shortage of Chips is global and not just GPU. A Hardware tester like you, should not have problems in acquiring a GPU to do these tests, otherwise, you have a serious public relations problem.And returning to the point of my criticism, I think that those who understand why CPU scaling is tested in games, it is not only FPS, but also being able to evaluate longevity to upgrade to future GPUs or which CPU will generate a bottleneck sooner. that other. Today all CPUs can run games at 4k and that's not news to anyone.
In short, if you cannot get a decent GPU to test a top-of-the-range CPU and its limitations with different hardware combinations, try to eliminate the GPU bottleneck with 720p / 1080p resolutions or by dropping detail from excene. That is the correct way to test the other points and not the GPU itself.
This criticism is constructive, and is not intended to generate repudiation.
TheinsanegamerN - Monday, January 3, 2022 - link
Erm, you do know that other reviewers have been able to get ahold of GPUs for testing, right? If you dont have the budget for the stuff you need to do your job, cant get the stuff you need to do your job, and find excuses to now do the reviews your viewerbase wants to so, that says to a lot of people that anandtech is being mismanaged into the ground.Come to think of it, these same excuses were used when the 3080 was never reviewed, alongside "well we have one guy who does it and he lives near the fires in cali". That was a year and a half ago.
Perhaps Anandtech presenting excuses instead of articles is why you cant get companies to send you hardware? Just a thought.
Azix - Monday, January 10, 2022 - link
I can understand manufacturers being less likely to send out a GPU if they aren't guaranteed publicity. The key is that he said just for testing, not necessarily for a review. Most other reviewers are given for marketing purposes.zheega - Thursday, December 23, 2021 - link
I didn't even notice that at first, I just assumed that they would get rid of the GPU bottleneck. How amazingly weird.thestryker - Thursday, December 23, 2021 - link
The vast majority of people play at the highest playable resolution for the hardware they have which means they're GPU bound no matter what their GPU is. The frame rates in the review are perfectly playable and indicates the amount of variation one could expect for a mostly GPU bound situation. None of the titles are esports/competitive where you'd need to be maxing out frame rate so even if they were using a 3090 it'd be a pointless reflection for that.So while the metrics aren't perfect from a scaling under ideal circumstances perspective it's perfectly fine for practicality.
haukionkannel - Friday, December 24, 2021 - link
True. I have not latest PC hardware and still play at 1440p at highest settings. So I can confirm that is the way to test to see what we see in real world situation...Ooga Booga - Tuesday, December 28, 2021 - link
Because they haven't done meaningful GPU stuff in years, it all goes to Tom's Hardware. Eventually the card they use will be 10 years old if this site is even still around.TimeGoddess - Thursday, December 23, 2021 - link
If youre gonna use a gtx 1080 at least try and do the gaming benchmarks in 720p so that there is actually a CPU bottleneckIan Cutress - Thursday, December 23, 2021 - link
You know how many people complain when I run our CPU reviews at 720p resolutions? 'You're only doing that to show a difference'.