Silverstone MS12 and Yottamaster HC2-C3 USB 3.2 Gen 2x2 20Gbps Enclosures Reviewed
by Ganesh T S on August 12, 2021 10:00 AM EST- Posted in
- Storage
- SilverStone
- DAS
- USB 3.2 Gen 2x2
- Portable SSDs
- Yottamaster
PCMark 10 Storage Bench - Real-World Access Traces
There are a number of storage benchmarks that can subject a device to artificial access traces by varying the mix of reads and writes, the access block sizes, and the queue depth / number of outstanding data requests. We saw results from two popular ones - ATTO, and CrystalDiskMark - in a previous section. More serious benchmarks, however, actually replicate access traces from real-world workloads to determine the suitability of a particular device for a particular workload. Real-world access traces may be used for simulating the behavior of computing activities that are limited by storage performance. Examples include booting an operating system or loading a particular game from the disk.
PCMark 10's storage bench (introduced in v2.1.2153) includes four storage benchmarks that use relevant real-world traces from popular applications and common tasks to fully test the performance of the latest modern drives:
- The Full System Drive Benchmark uses a wide-ranging set of real-world traces from popular applications and common tasks to fully test the performance of the fastest modern drives. It involves a total of 204 GB of write traffic.
- The Quick System Drive Benchmark is a shorter test with a smaller set of less demanding real-world traces. It subjects the device to 23 GB of writes.
- The Data Drive Benchmark is designed to test drives that are used for storing files rather than applications. These typically include NAS drives, USB sticks, memory cards, and other external storage devices. The device is subjected to 15 GB of writes.
- The Drive Performance Consistency Test is a long-running and extremely demanding test with a heavy, continuous load for expert users. In-depth reporting shows how the performance of the drive varies under different conditions. This writes more than 23 TB of data to the drive.
Despite the data drive benchmark appearing most suitable for testing direct-attached storage, we opt to run the full system drive benchmark as part of our evaluation flow. Many of us use portable flash drives as boot drives and storage for Steam games. These types of use-cases are addressed only in the full system drive benchmark.
The Full System Drive Benchmark comprises of 23 different traces. For the purpose of presenting results, we classify them under five different categories:
- Boot: Replay of storage access trace recorded while booting Windows 10
- Creative: Replay of storage access traces recorded during the start up and usage of Adobe applications such as Acrobat, After Effects, Illustrator, Premiere Pro, Lightroom, and Photoshop.
- Office: Replay of storage access traces recorded during the usage of Microsoft Office applications such as Excel and Powerpoint.
- Gaming: Replay of storage access traces recorded during the start up of games such as Battlefield V, Call of Duty Black Ops 4, and Overwatch.
- File Transfers: Replay of storage access traces (Write-Only, Read-Write, and Read-Only) recorded during the transfer of data such as ISOs and photographs.
PCMark 10 also generates an overall score, bandwidth, and average latency number for quick comparison of different drives. The sub-sections in the rest of the page reference the access traces specified in the PCMark 10 Technical Guide.
Booting Windows 10
The read-write bandwidth recorded for each drive in the boo access trace is presented below.

The numbers are too close to represent any significant discernible differences in the boot time between the MS12 and HC2-C3.
Creative Workloads
The read-write bandwidth recorded for each drive in the sacr, saft, sill, spre, slig, sps, aft, exc, ill, ind, psh, and psl access traces are presented below.
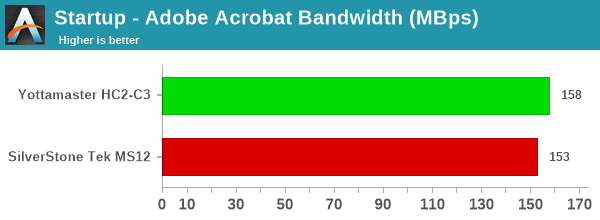
Across all the workloads, the HC2-C3 comes out with the lead, but there is no dignificant gulf similar to what was seen in the Blu-ray folder write workload in the robocopy tests.
Office Workloads
The read-write bandwidth recorded for each drive in the exc and pow access traces are presented below.

The HC2-C3 emerges with a slight lead for both workloads.
Gaming Workloads
The read-write bandwidth recorded for each drive in the bf, cod, and ow access traces are presented below.
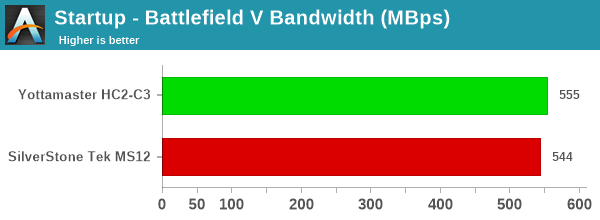
There is not much of a difference between the MS12 and HC2-C3 as far as gaming workloads are concerned. As we saw in the robocopy benchmarks, the MS12 only suffered a bit in the write workload for one particular trace. Since gaming workloads are mostly read-heavy, we do not see the issue reflected in the above graphs.
Files Transfer Workloads
The read-write bandwidth recorded for each drive in the cp1, cp2, cp3, cps1, cps2, and cps3 access traces are presented below.
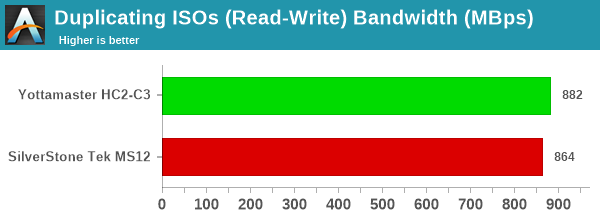
The HC2-C3 again emerges with a slight lead over the MS12 across all the file transfer workloads.
Overall Scores
PCMark 10 reports an overall score based on the observed bandwidth and access times for the full workload set. The score, bandwidth, and average access latency for each of the drives are presented below.
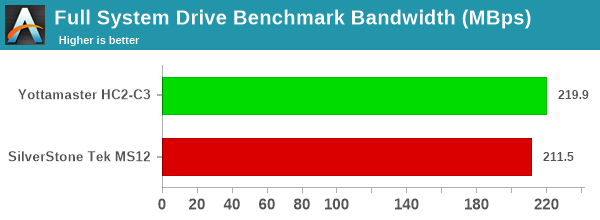
Using the SK hynix Gold P31 in the SilverStone MS12 leads to a slight drop in performance compared to using it with the Yottamaster HC2-C3. It is not a significant drop, but one that must still be noted.


21 Comments
View All Comments
qnesystem1 - Monday, May 2, 2022 - link
The same regulation also applies to the top 500 median provincial taxpayers in each tax district that ranks as a large taxpayer. With the activation of the BIR https://www.qne.com.ph/small-business-ideas-philip... Special Working Group called the Computerized Systems Assessment Team (CSET) to monitor medium and large taxpayers, more active campaigns and stricter enforcement by tax authorities are expected.