The Inland Performance Plus 2TB SSD Review: Phison's E18 NVMe Controller Tested
by Billy Tallis on May 13, 2021 8:00 AM ESTBurst IO Performance
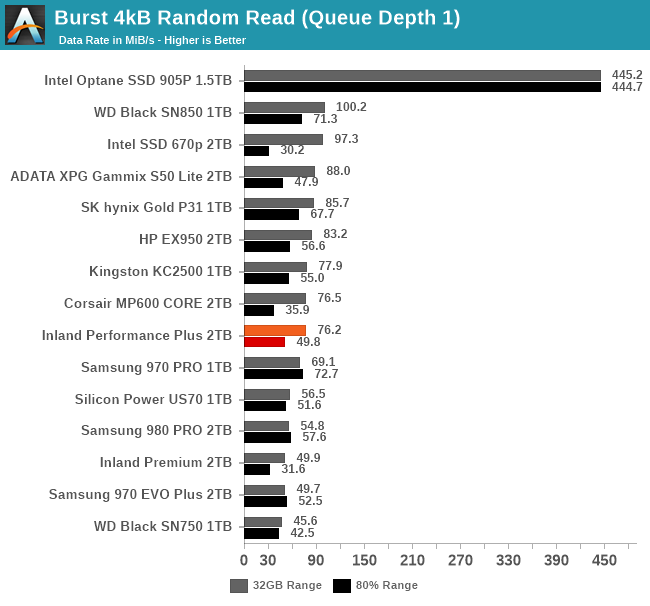
Our burst IO tests operate at queue depth 1 and perform several short data transfers interspersed with idle time. The random read and write tests consist of 32 bursts of up to 64MB each. The sequential read and write tests use eight bursts of up to 128MB each. For more details, please see the overview of our 2021 Consumer SSD Benchmark Suite.
 |
|||||||||
| Random Read | Random Write | ||||||||
| Sequential Read | Sequential Write | ||||||||
On the QD1 burst IO tests, the Inland Performance Plus tops the charts for both random and sequential writes, though in the latter case performance drops quite a lot when the drive is mostly full. Random read performance is merely average, and sequential reads are disappointingly in last place.
Sustained IO Performance
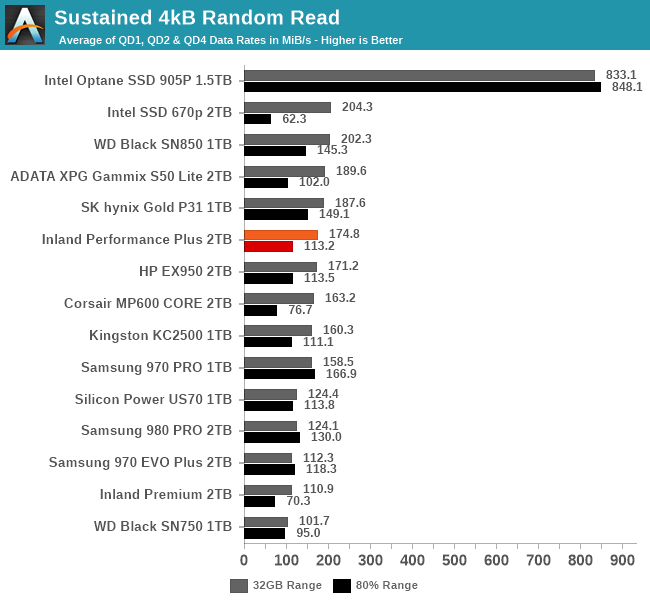
Our sustained IO tests exercise a range of queue depths and transfer more data than the burst IO tests, but still have limits to keep the duration somewhat realistic. The primary scores we report are focused on the low queue depths that make up the bulk of consumer storage workloads. For more details, please see the overview of our 2021 Consumer SSD Benchmark Suite.
 |
|||||||||
| Random Read | Throughput | Power | Efficiency | ||||||
| Random Write | Throughput | Power | Efficiency | ||||||
| Sequential Read | Throughput | Power | Efficiency | ||||||
| Sequential Write | Throughput | Power | Efficiency | ||||||
On the longer IO tests that bring in some higher queue depths, the Performance Plus loses its first-place spot for random writes to the WD Black SN850, but it hangs on to first place for sequential writes. For both random and sequential reads it manages to improve its standings slightly, but the sequential read performance remains disappointing. Power efficiency isn't great on any of these four tests, but it's decent for sequential writes and more or less matches the flagship Gen4 drives from WD and Samsung.
 |
|||||||||
| Random Read | |||||||||
| Random Write | |||||||||
| Sequential Read | |||||||||
| Sequential Write | |||||||||
The Inland Performance Plus does eventually reach top-tier performance for sequential reads, but it requires higher queue depths than the 980 PRO or SN850. For sequential writes, it has taken a clear lead by QD4 and maintains higher performance than any of the other drives can hit, with only a slight drop at the end of the test suggesting that the SLC cache might be starting to run out.
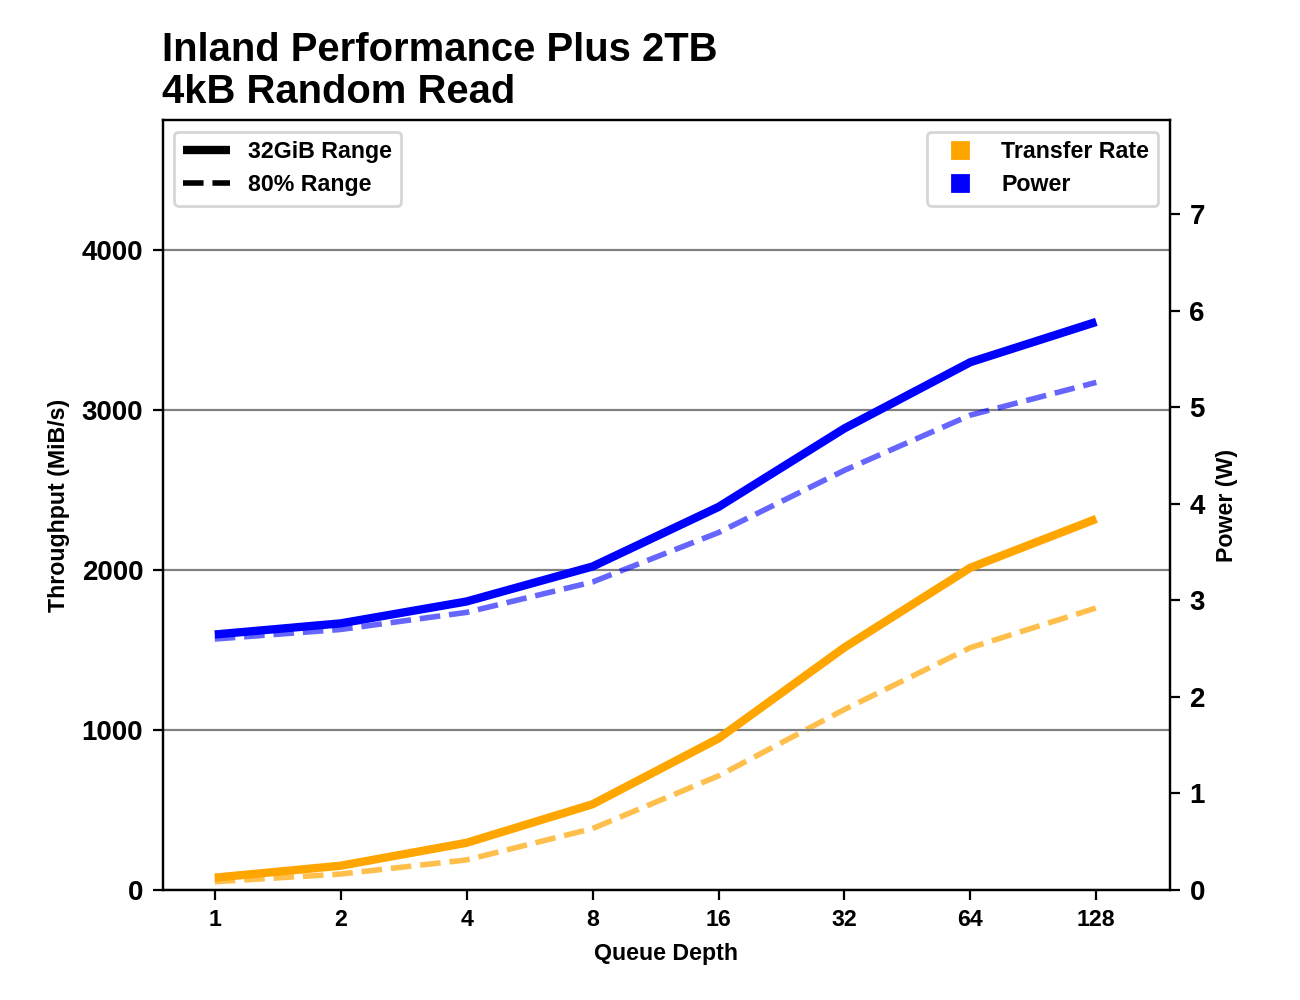
For random reads and writes, the Performance Plus simply doesn't scale up as high as its competitors, even with very large queue depths. The Samsung 980 PRO's maximum random write speeds are well beyond what any other drive hits, and for random reads the WD Black SN850 has a similarly large lead over the competition.
Random Read Latency
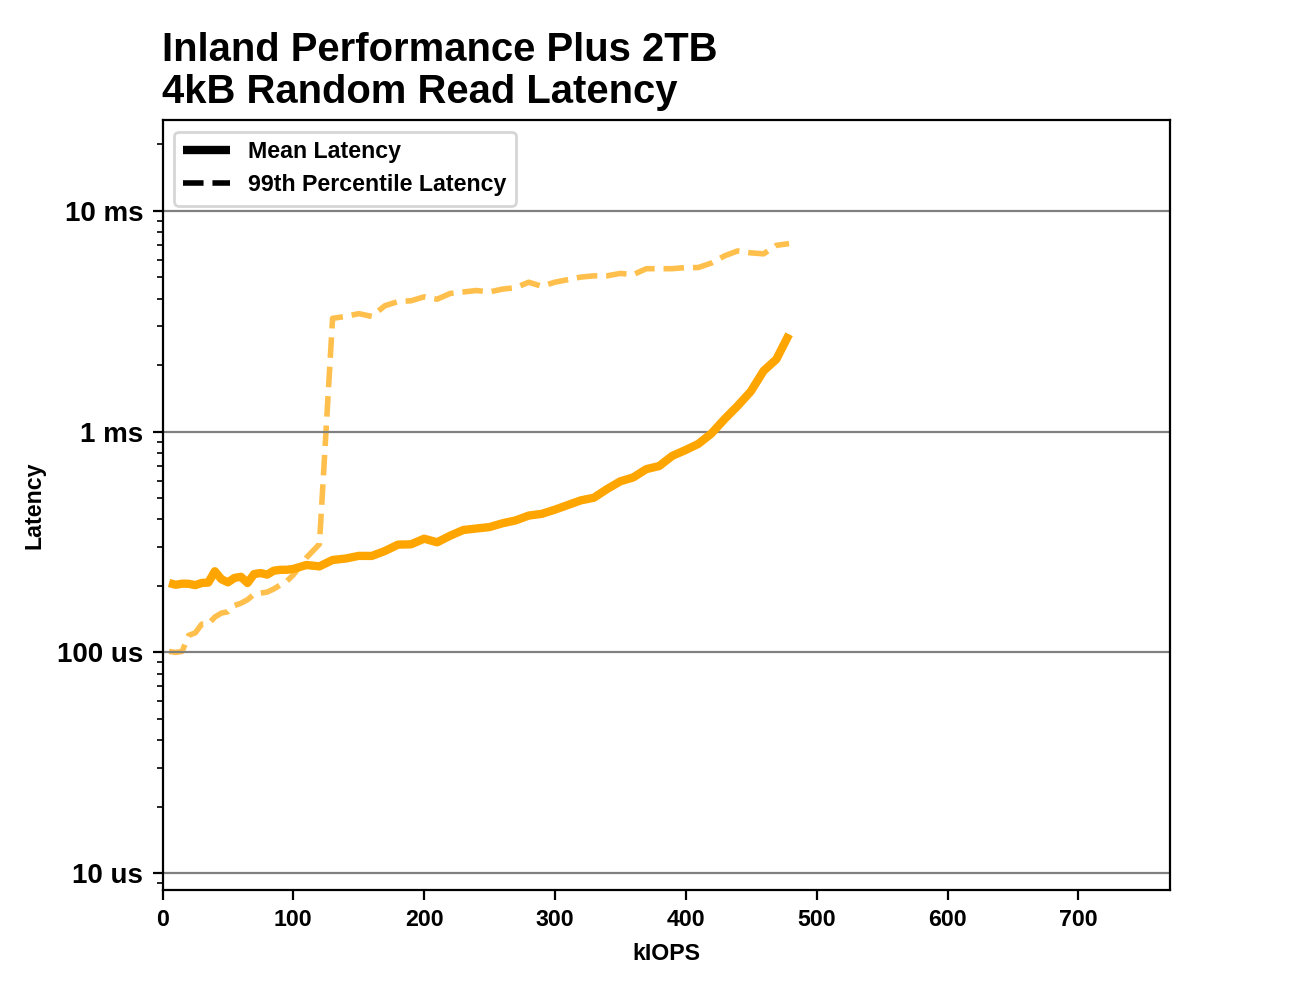
This test illustrates how drives with higher throughput don't always offer better IO latency and Quality of Service (QoS), and that latency often gets much worse when a drive is pushed to its limits. This test is more intense than real-world consumer workloads and the results can be a bit noisy, but large differences that show up clearly on a log scale plot are meaningful. For more details, please see the overview of our 2021 Consumer SSD Benchmark Suite.
 |
|||||||||
At low rates, the mean latency from the Inland Performance Plus is actually higher than the 99th percentile latency, indicating there's a small number of extremely high-latency IOs skewing the average. The median latency starts at a very respectable 63µs, but the highest latency measured at low rates is close to 70ms—three orders of magnitude slower. This looks like the drive might be stalling while waking up from a sleep state, which it shouldn't even be entering given the minimal idle time between test phases. Above 120k IOPS, the 99th percentile latency jumps up to the millisecond range, which should only happen to a drive this high-end when it's pretty close to its maximum throughput. The Performance Plus does achieve respectable throughput that is a clear improvement over the Phison E16, but compared to WD and Samsung flagships the E18 drive is slower and has some mildly concerning performance quirks.


118 Comments
View All Comments
teldar - Thursday, May 13, 2021 - link
This seems ridiculous? OS queries are typically non sequential. This limits performance of everything. It's not like it's unknown that the next real step should be combined storage and ram, something that optane was supposed to do.Billy Tallis - Friday, May 14, 2021 - link
> OS queries are typically non sequential.To quantify this a bit, when I had Windows Explorer tally up the disk usage of my photos folders, about 35% of the IOs were sequential, and just over half at QD1. That should have been operating mostly on file metadata, rather than sequentially reading the actual file contents.
Valantar - Thursday, May 13, 2021 - link
Synthetic? What? The main ATSB test suite here consists of 100% real-world application traces. Sure, there are synthetics too, but the reviews are pretty explicit in pointing out that the value of those tests are mostly academic, and rather serve to illustrate why we see the differences we do in the ATSB tests.mode_13h - Thursday, May 13, 2021 - link
Please ignore the troll.Synthetics are useful for testing manufacturer claims, exploring corner cases, boundary conditions, and the outer performance envelope.
Real-world benchmarks give users some idea of what they can expect and show how the characteristics revealed in the synthetics relate to practical user experience.
Without reviews like the ones at Anandtech, manufacturers would be trying to get away with a lot more sketchy stuff, I fear, and making even more outlandish claims.
jabber - Thursday, May 13, 2021 - link
I have to say the upgrade from SSD to NVMe was one of the biggest disappointments in my computing life. There is a law of diminishing returns in day to day performance once you reach and go past 500MBps.mode_13h - Thursday, May 13, 2021 - link
Do you use antivirus? On the windows PC I use for work, they hav it so bogged down with security software that I might as well be using a hard drive!On Linux, I saw a marked difference between SATA and NVMe.
Tomatotech - Friday, May 14, 2021 - link
It depends on your OS & system. On my MacBooks, I saw a large difference going from an old but adequate 2013-era 128GB SSD to a 1TB 2019 NVMe. The new NVME was literally 3x faster in every way than the SSD and it made a huge difference to the laptop. Felt like new again.Like most things in tech, it takes around a doubling in speed for the difference to be noticeable to the user.
mode_13h - Thursday, May 13, 2021 - link
> Until Microsoft unshackles Windows from the magnetic Hard disk eraPlease explain what you mean by this. Also, not all of us are using Windows.
> I suppose these reviews and their hairsplitting synthetic benchmarks get clicks.
If you feel it's not relevant to you, then please *don't* click. And spare us your whining, as well!
I'm happy to have this review. I appreciate seeing the detailed performance analysis, as well as how much light it sheds on SSDs, their inner workings, and the overall SSD industry.
FunBunny2 - Saturday, May 15, 2021 - link
"Also, not all of us are using Windows."so far as AT Management goes, yes we are. how much ink is devoted to anything else, aka linux?
Billy Tallis - Saturday, May 15, 2021 - link
All of the synthetic tests in our SSD reviews are using Linux.