The Inland Performance Plus 2TB SSD Review: Phison's E18 NVMe Controller Tested
by Billy Tallis on May 13, 2021 8:00 AM ESTAdvanced Synthetic Tests
Our benchmark suite includes a variety of tests that are less about replicating any real-world IO patterns, and more about exposing the inner workings of a drive with narrowly-focused tests. Many of these tests will show exaggerated differences between drives, and for the most part that should not be taken as a sign that one drive will be drastically faster for real-world usage. These tests are about satisfying curiosity, and are not good measures of overall drive performance. For more details, please see the overview of our 2021 Consumer SSD Benchmark Suite.
Whole-Drive Fill
 |
|||||||||
| Pass 1 | |||||||||
| Pass 2 | |||||||||
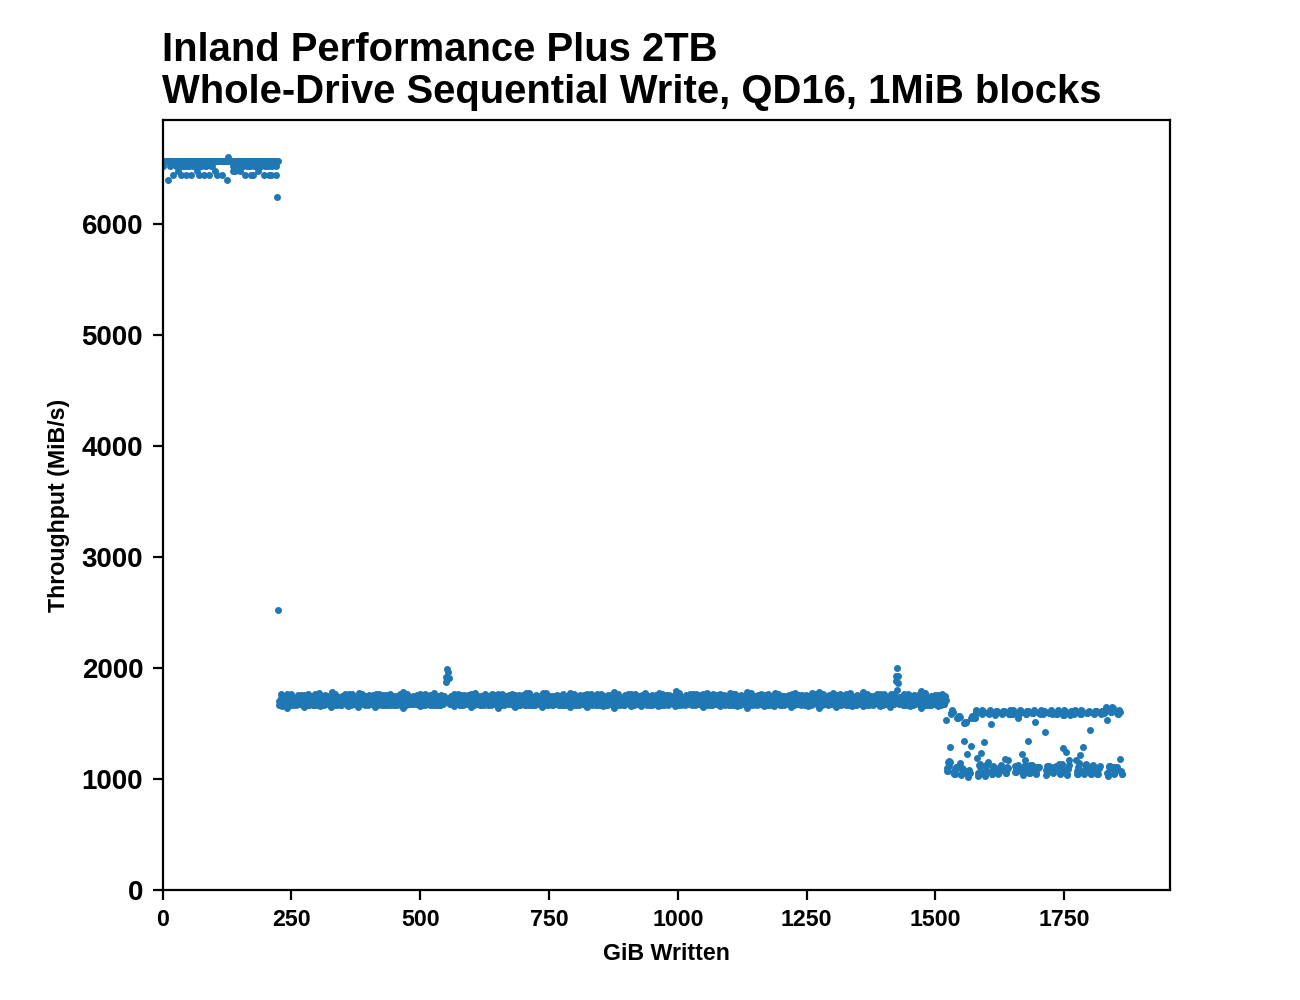
The SLC write cache on the 2TB Inland Performance Plus lasts for about 225GB on first pass (about the same cache size as 980 PRO, but a bit faster), and about 55GB on the second pass when the drive is already full. Performance during each phase of filling the drive is quite consistent, with the only significant variability showing up after the drive is 80% full. Sequential write performance during the SLC cache phase is higher than any other drive we've tested to date.
 |
|||||||||
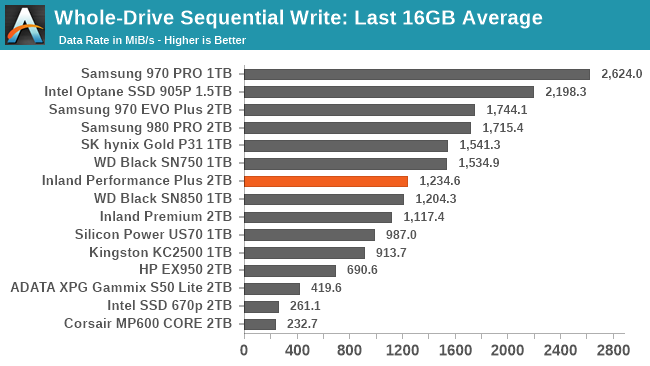
| Average Throughput for last 16 GB | Overall Average Throughput | ||||||||
The post-cache performance is a bit slower than the fastest TLC drives, but overall average throughput is comparable to other top TLC drives. The Inland Performance Plus is still significantly slower than the MLC and Optane drives that didn't need a caching layer, but one or two more generational improvements in NAND performance may be enough to overcome that difference.
Working Set Size
 |
|||||||||
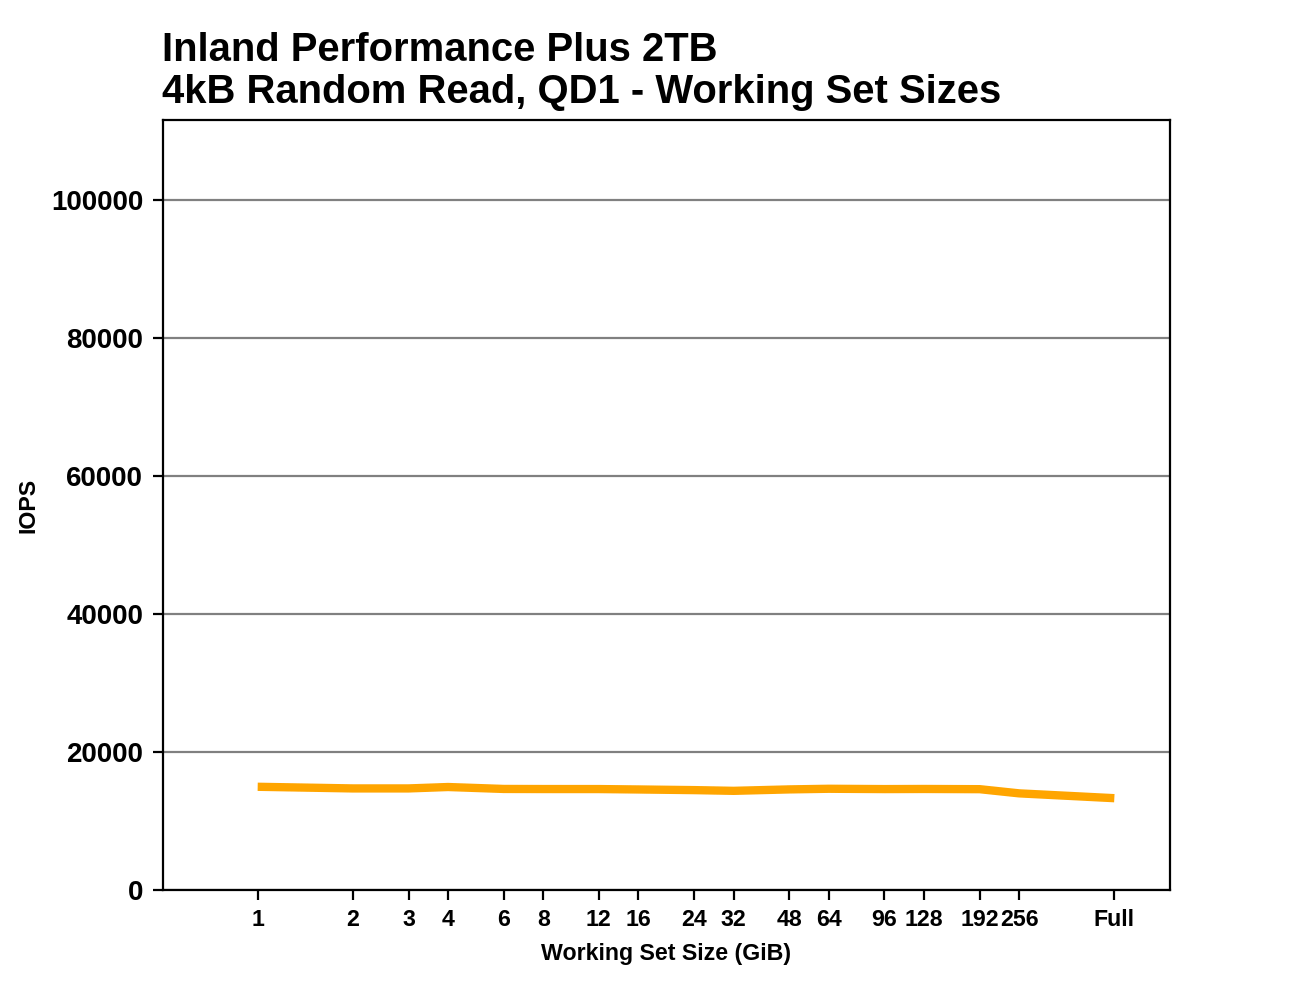
As expected from a high-end drive with a full-sized DRAM buffer, the random read latency from the Inland Performance Plus is nearly constant regardless of the working set size. There's a slight drop in performance when random reads are covering the entire range of the drive, but it's smaller than the drop we see from drives that skimp on DRAM.
Performance vs Block Size
 |
|||||||||
| Random Read | |||||||||
| Random Write | |||||||||
| Sequential Read | |||||||||
| Sequential Write | |||||||||
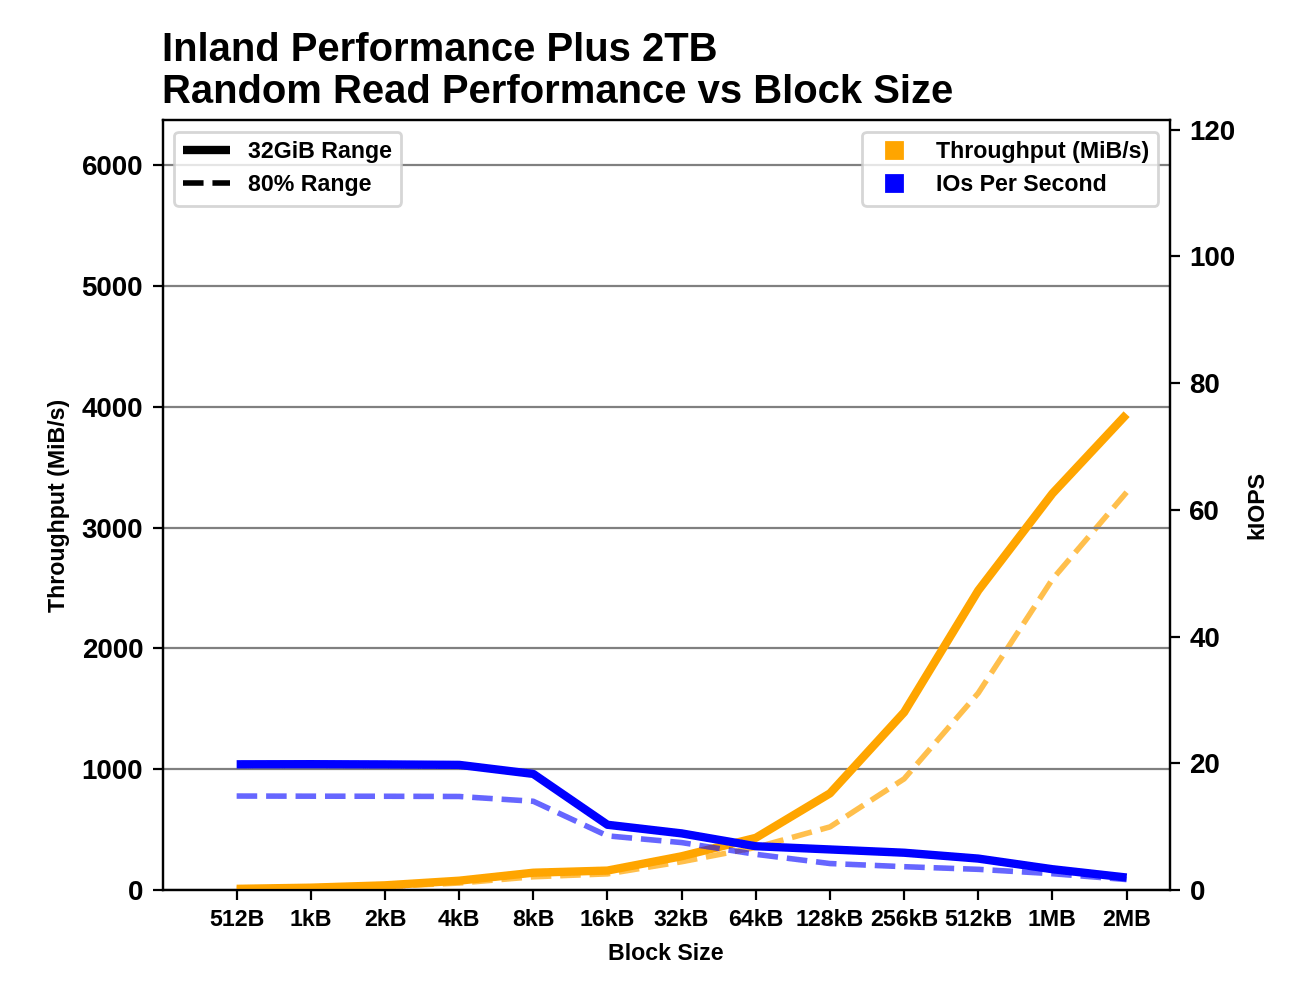
There are no big surprises from testing the Inland Performance Plus with varying block sizes. The Phison E18 controller has no problem handling block sizes smaller than 4kB. The random write results are a little rough especially when testing the drive at 80% full, but it's hardly the only drive to have SLC cache troubles here. Like many other drives, the sequential read performance doesn't scale smoothly with the larger block sizes, and the drive really needs a larger queue depth or very large block size to deliver great sequential read performance.


118 Comments
View All Comments
RSAUser - Friday, May 14, 2021 - link
Even then, storage is substantially cheaper than RAM, but it will be interesting to see if e.g. 64-128GB RAM configs will become a more common thing (since 64GB/memory die on DDR5 vs 16GB/die on DDR4).oRAirwolf - Thursday, May 13, 2021 - link
Great article as always. I do wish Anandtech would add some real world performance numbers like Windows load times, game load times, file transfer speeds, etc.jospoortvliet - Friday, May 14, 2021 - link
That is exactly what the trace tests on page 2 are.Spunjji - Friday, May 14, 2021 - link
Those kind of tests aren't going to show any noticeable differences. I'm saying this as someone who has personally messed around with configurations like having 6 SATA 3 SSDs in RAID-0, various flavours of NVMe, etc.mode_13h - Saturday, May 15, 2021 - link
> having 6 SATA 3 SSDs in RAID-0Depends on your controller and how it's connected. I have a fileserver with 3x SATA SSDs in a RAID-5, and my bottleneck is the DMI link.
Spunjji - Monday, May 17, 2021 - link
Sort-of, and sort-of not - you'll get lower performance on devices connected over a chipset link than directly, but in terms of Windows and game load times you're rarely going to see more than single-second differences.For the record, my 6-drive array was connected directly to the CPU via a PCIe 3.0 8x RAID card. It would be handily outperformed by a modern ~1TB NVMe drive, and the RAID BIOS initialization time easily eclipsed the minor difference it made to Windows load times over a single drive. I didn't keep it around for long - it was just a thing I tried because I ended up with a bunch of 256GB SATA SSDs and some spare time.
edzieba - Monday, May 17, 2021 - link
I'd love to see the recent crop of "New Faster PCIe 4.0!" drives be tested on both PCIe 4.0 and PCIe 3.0 (on the same system, just with the bus capped) to control for meaningful improvements i ndrive controller performance vs. meaning improvements from link rate increase.I suspect that the majority of performance gain from new drives is down to using newer controllers, and those without PCIe 4.0 capable boards would see near identical performance.
KarlKastor - Tuesday, May 18, 2021 - link
@Billy TallisCan you please write the NAND manufacturer in the lists? You just write the No of Layers. The difference between Toshiba and Micron NAND were sometimes quite huge in the past.