Kishonti GFXBench 5.0 Aztec Ruins: OpenGL & Vulkan Benchmark Hands-On
by Andrei Frumusanu on August 24, 2018 12:30 PM EST- Posted in
- Mobile
- Smartphones
- Benchmarks
- GFXBench

Today Kishonti have finally released their final update to GFXBench version 5.0. The update introduces the new Aztec Ruins scene in two complexity modes as well as OpenGL, Vulkan, and Metal. The company had first announced the new benchmark in 2016 at GDC, and we had largely expected it to come out in 2017. Polishing the new benchmark to run in an orderly fashion in new low-level APIs such as Vulkan, Metal and DirectX12 is undoubtedly a very large task that takes time.
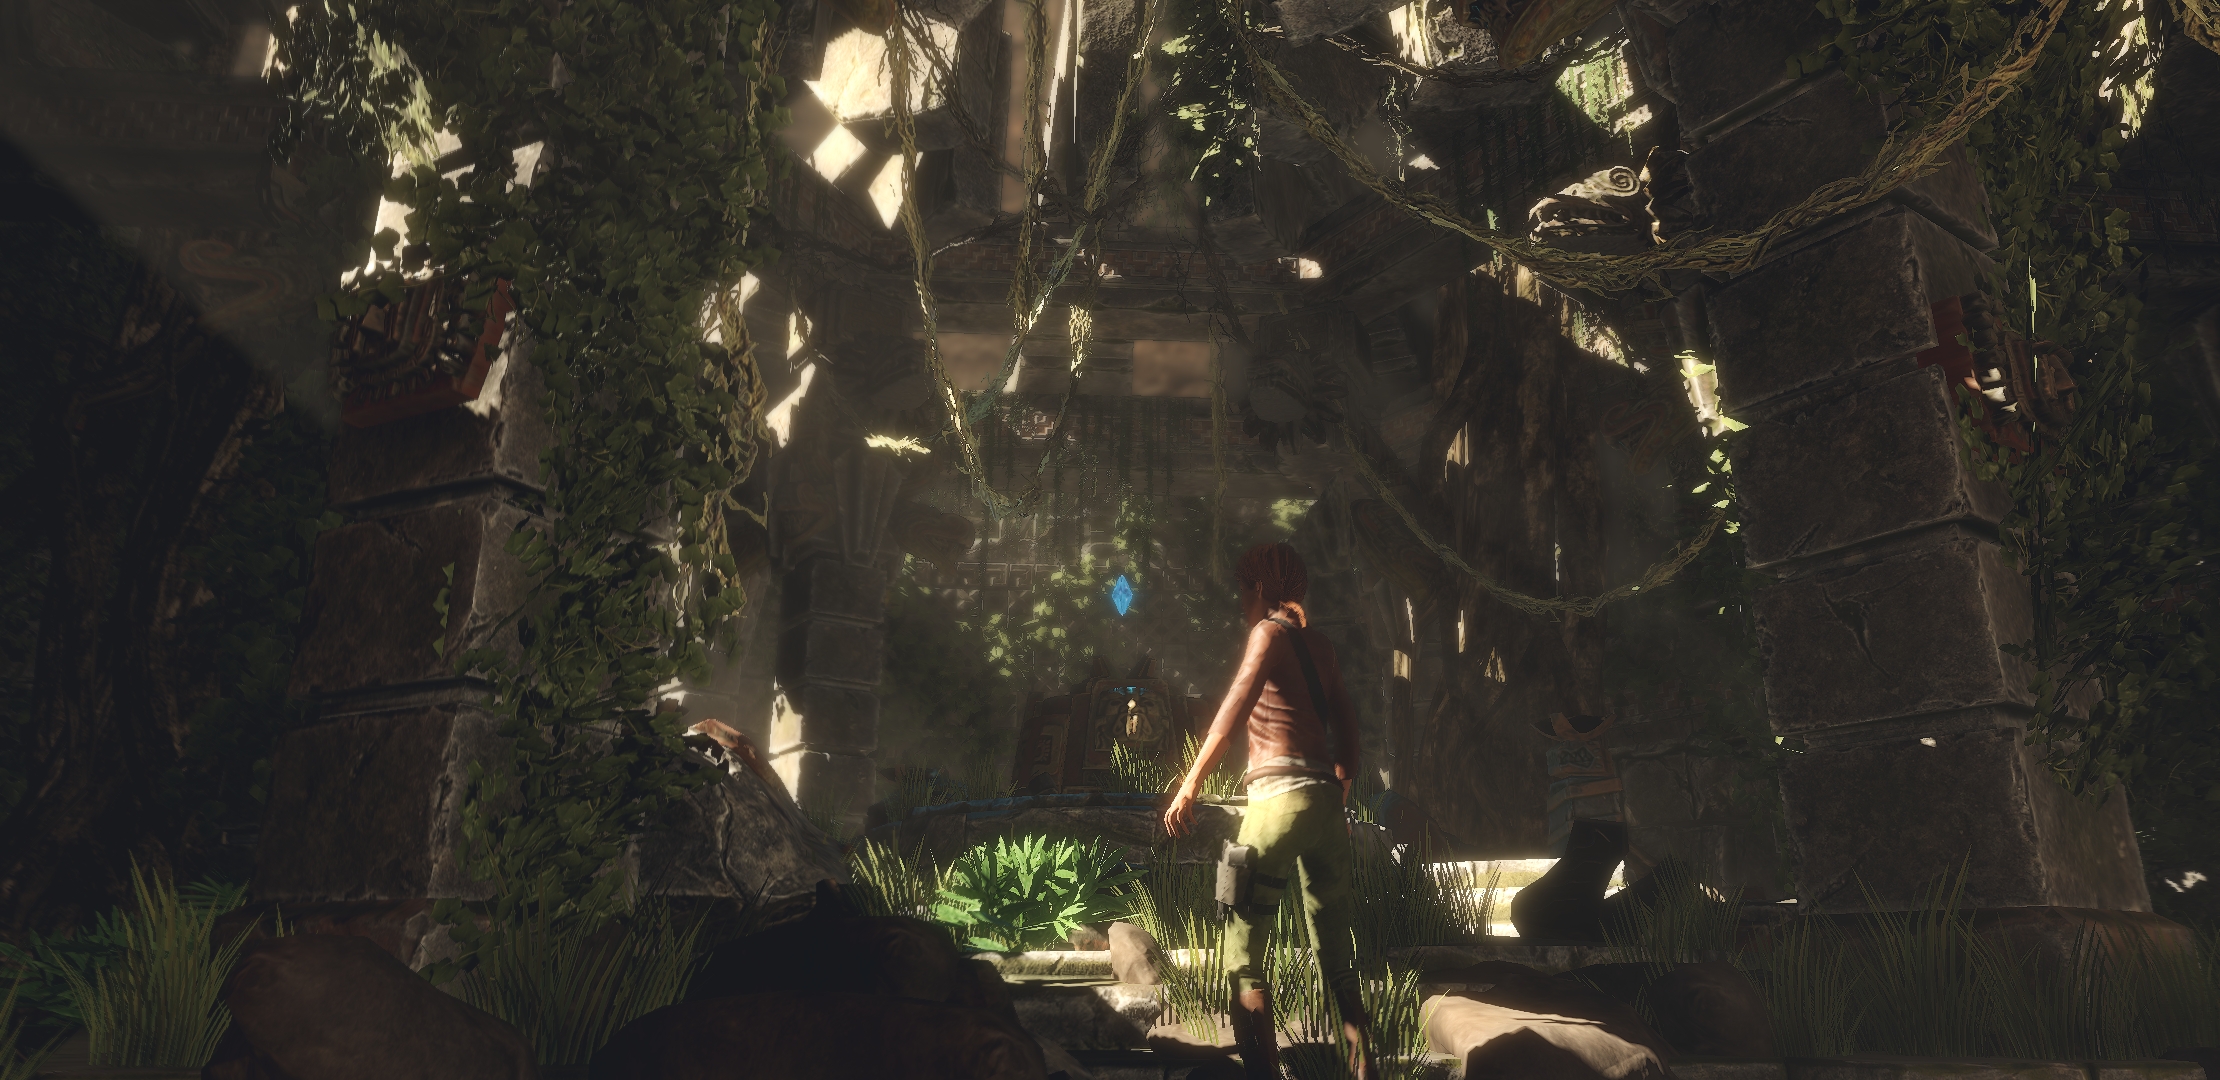
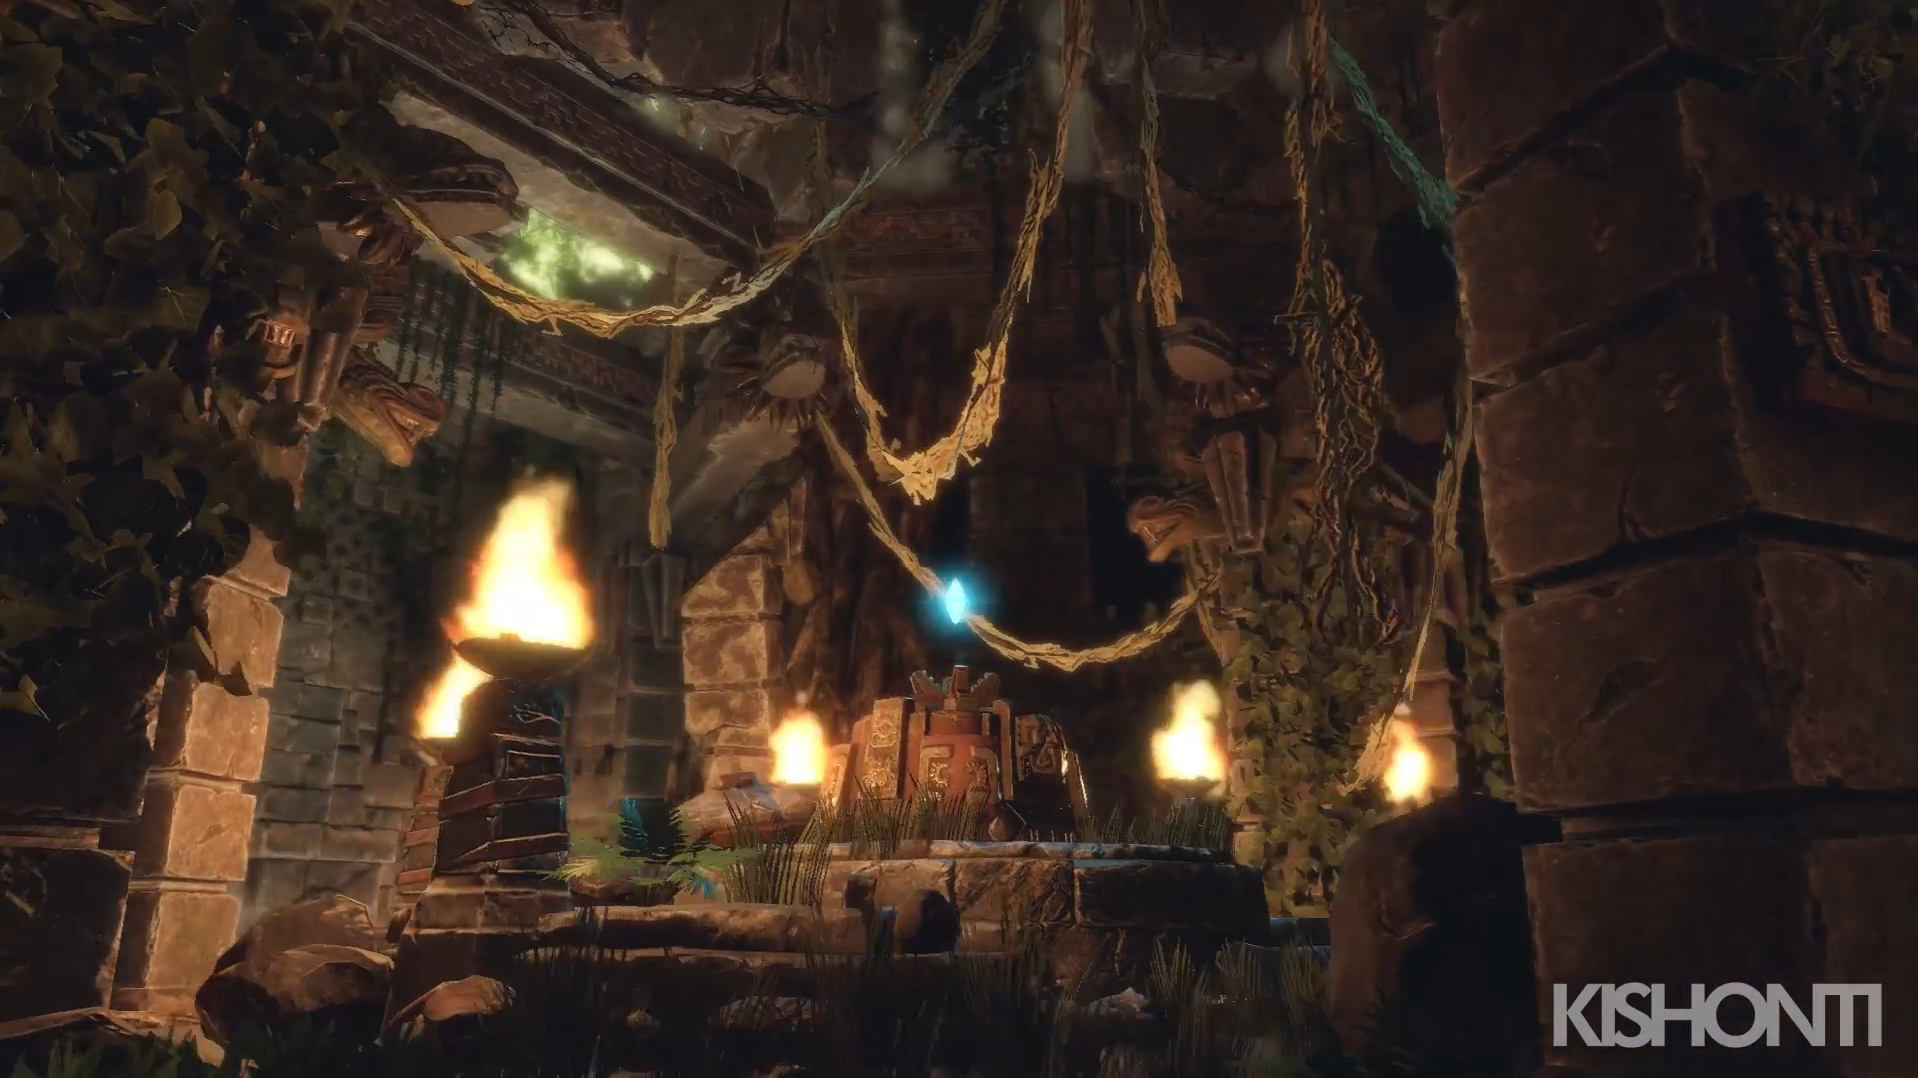
The new version runs on a new in-house rendering engine and introduces two new tests: Aztec Ruins (High Tier) and Aztec Ruins (Normal Tier). The scene is very much reminiscent of Tomb Raider, showcasing a jungle ruin environment, with an action-adventure like scene.
The new benchmark on Android includes the option to run it either in Vulkan, or OpenGL mode, which adds to our current set of dual-API benchmarks which include UL’s 3DMark Sling Shot and Basemark’s Basemark GPU test. This is of particular interest because it serves as a tool which can showcase GPU vendor’s driver quality, in particular how the new Vulkan implementation performs to the more polished and optimised OpenGL drivers.
I’m planning to include Aztec Ruins into our mobile benchmarking suite, and here it’s good to give a bit more of an explanation of what the new test brings and how it differs from past tests.
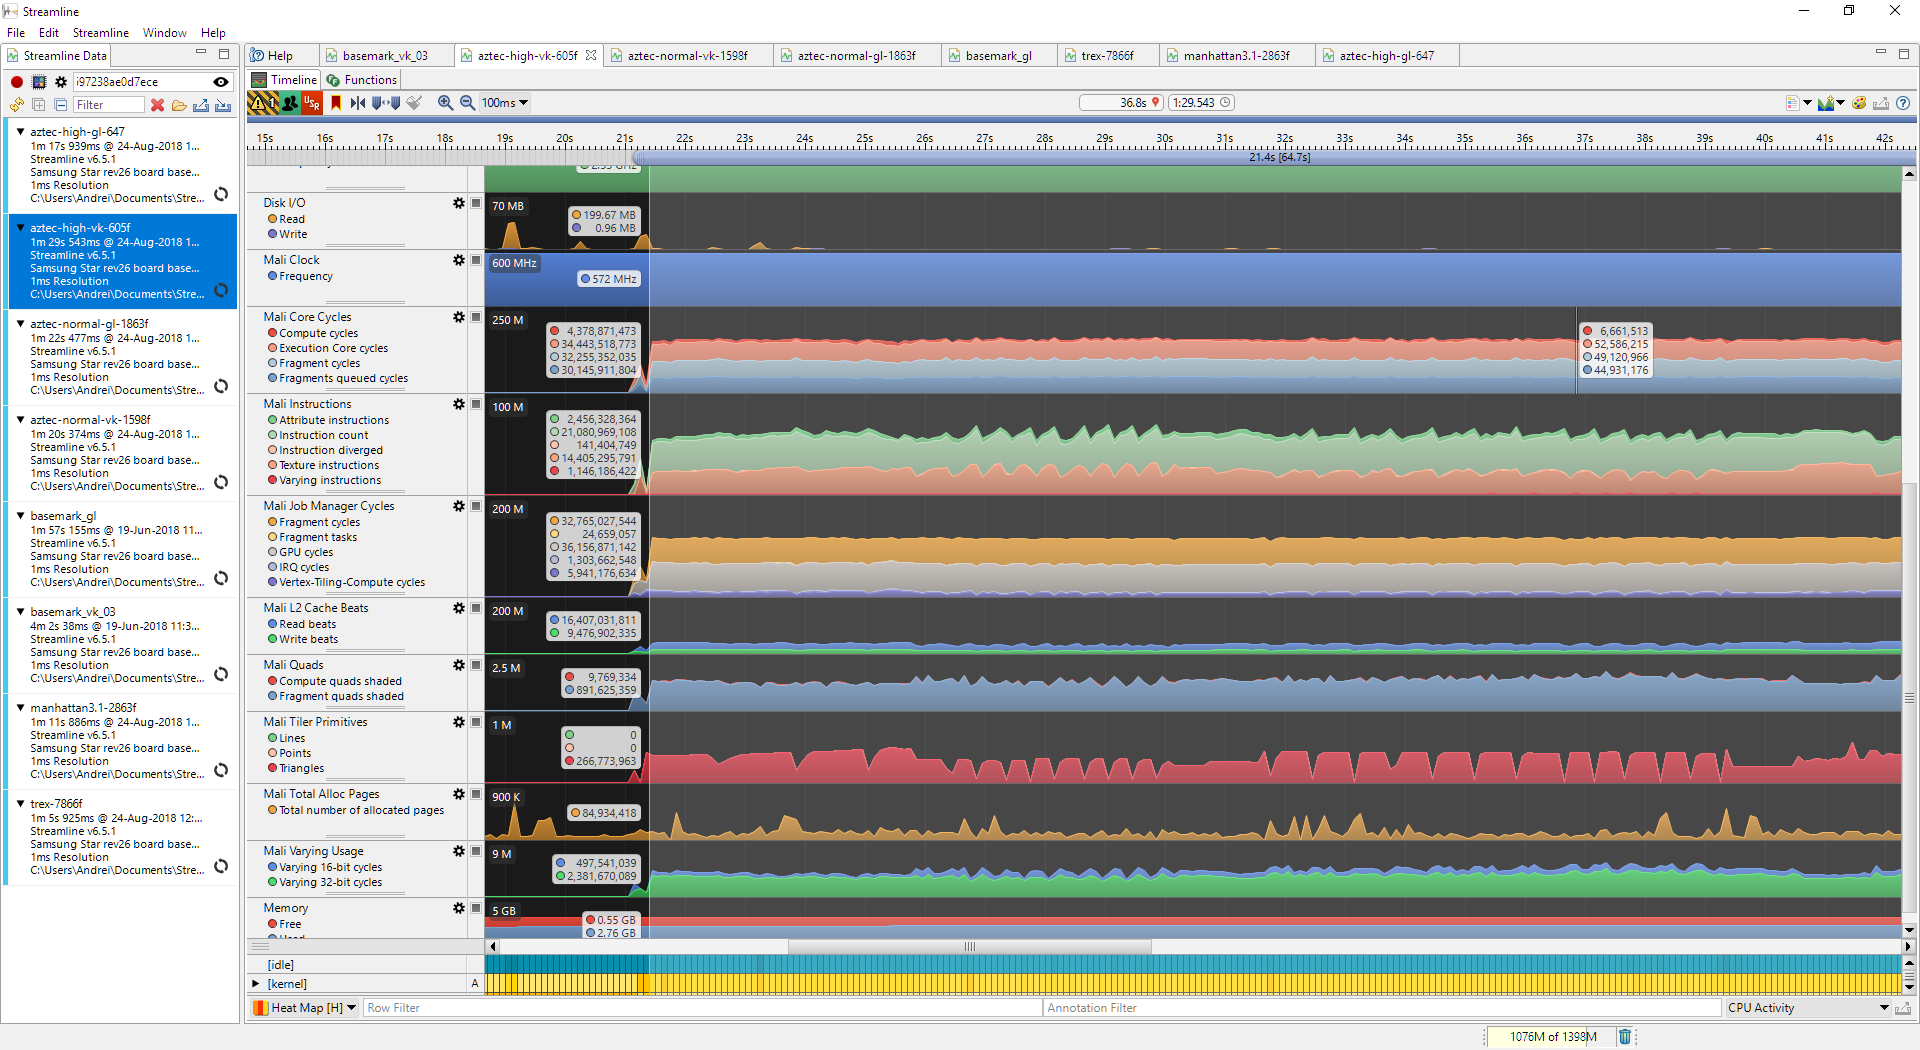
Profiling the new tests
I’ve profiled the new tests through Arm’s performance profiler on a Samsung Galaxy S9 running an Exynos 9810 with a Mali G72MP18 GPU. The reason here is simply that Arm’s profiler is one of the more complete software tools at hand that discloses more detailed information about 3D workloads on the GPU. The analysis could have been completed with a Snapdragon Profiler or any other vendor’s tools.
| AnandTech | Aztec High |
Aztec Normal |
Manhattan 3.1 |
T-Rex | |
| Scene length | 64.3s | 64.3s | 62s | 56s | |
| Resolution | 2560 x 1440 | 1920 x 1080 | 1920 x 1080 | 1920 x 1080 | |
| Compute Shaded Pixels | ~1.5% of work | ~1.5% of work | ~3% of work | ~2.4% of work | |
| Total Shaded Pixels | ~5.80M / frame ~161% of scene |
~2.64M / frame ~127% of scene |
~1.90M / frame ~92% of scene |
~0.65M / frame ~31% of scene |
|
| Av Triangles Per Frame | ~440K | ~207K | ~244K | ~724K | |
| Memory B/W Per Frame (GPU specific) |
Vulkan | 652MB (413R + 239W) |
268MB (160R + 107W) |
135MB (88R + 46W) |
73MB (51R + 22W) |
| OpenGL | 514MB (331R + 182W) |
242MB (154R + 87W) |
|||
As a note, because the data was collected on a Mali GPU, some characteristics will be GPU-specific, such as the bandwidth figures, as these will vary across GPU and SoC architectures.
Aztec Ruins: Normal
Starting off with Aztec Ruins in its “normal” mode, we largely see an evolution from the Manhattan 3.1 workload. Here the benchmark runs at a default 1080p, and we’re testing in off-screen mode in order to assure apples-to-apples comparisons across different phones.
The geometry complexity in normal mode comes in at an average of 207K triangles per frame, slightly less than Manhattan 3.1. While the geometry complexity is less, Aztec Normal increases the shader load by 38%, shading 127% as much pixels as contained in a full frame. Here the ratio exceeds 100% because we’re seeing shader effects overlap each other.
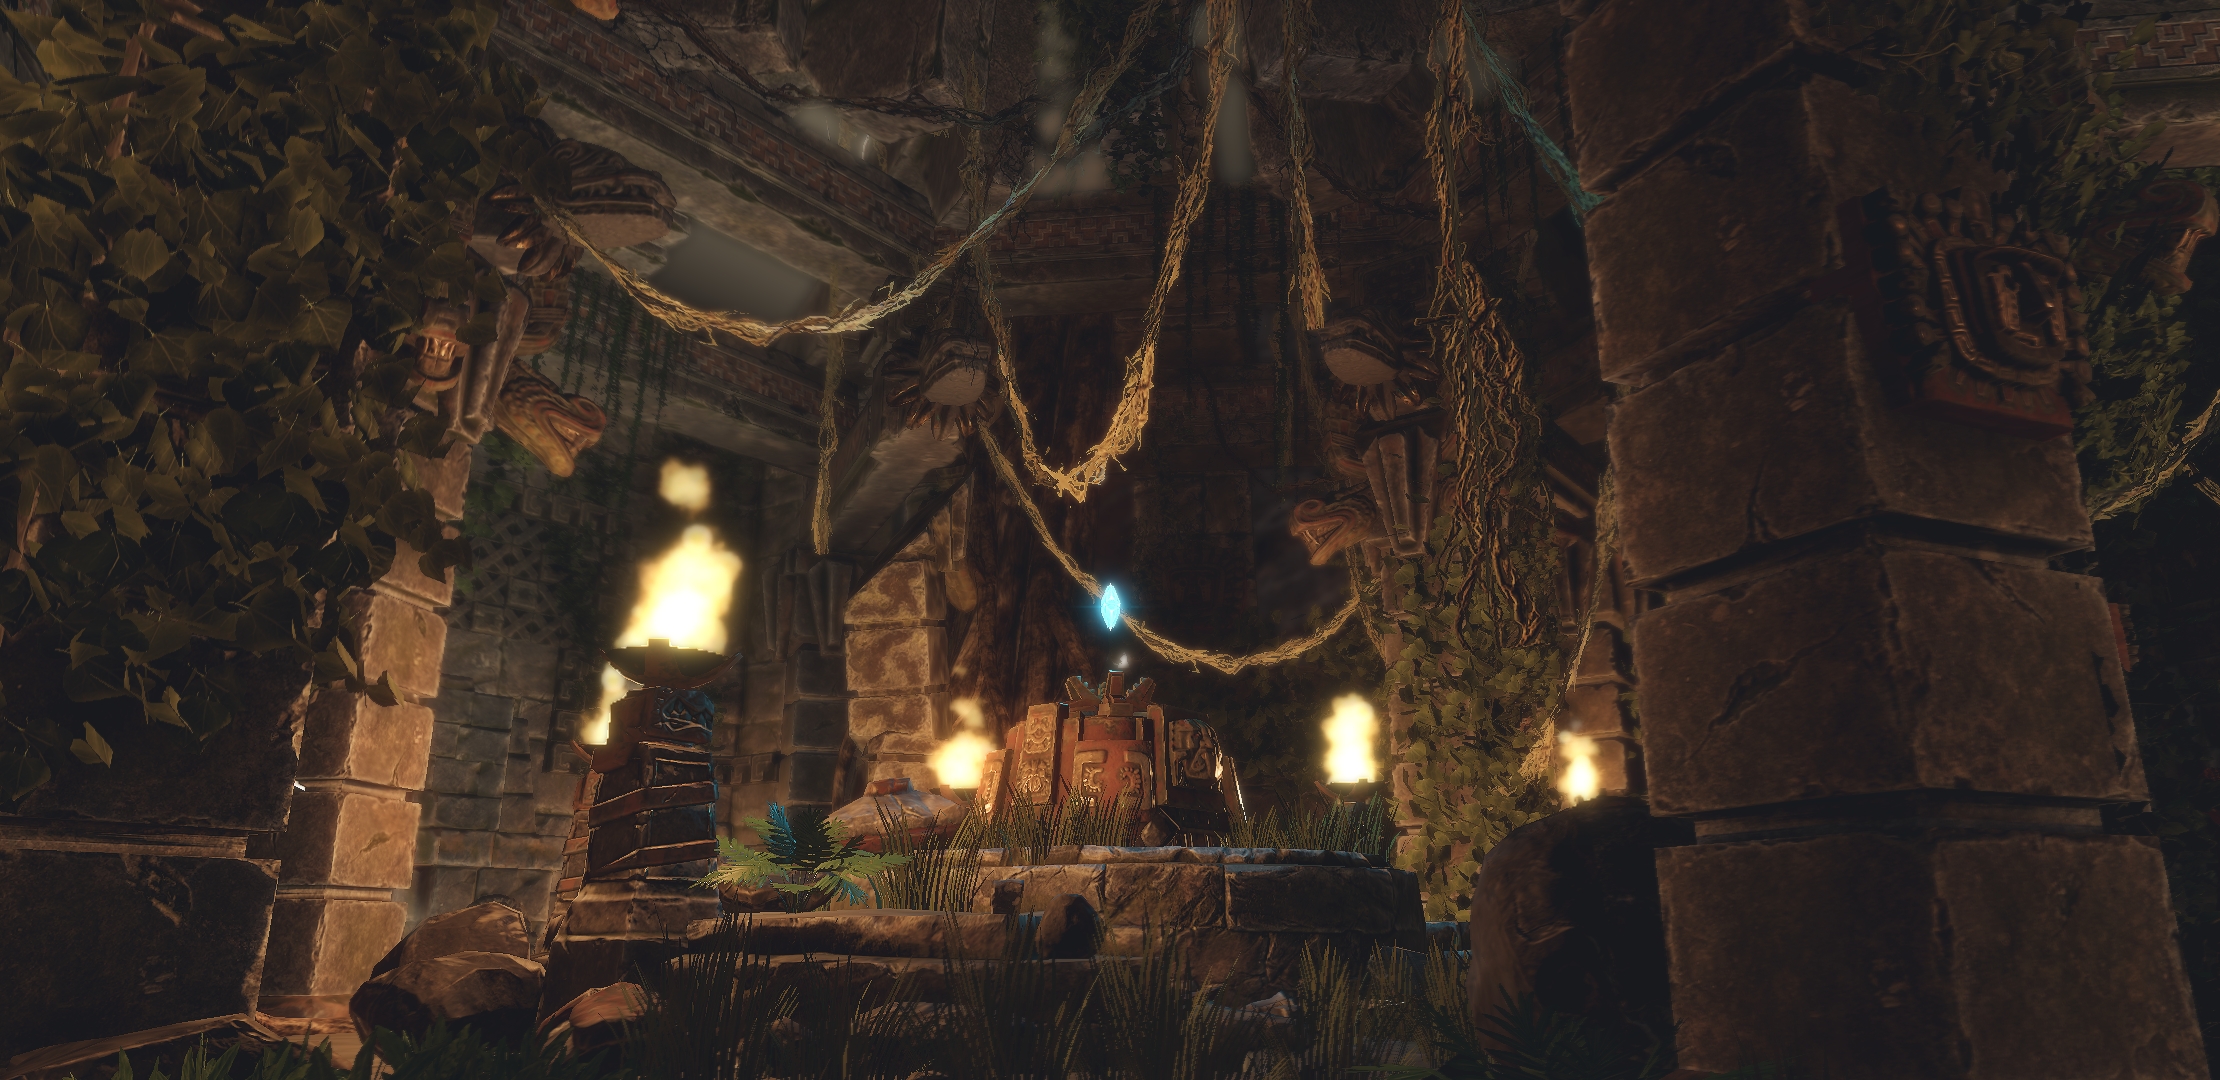
Aztec Ruins: High
The Aztec “High Tier” mode adds effects and complexity on top of what’s contained in the normal mode. There is generally more detail, such as more foliage, more grass tufts, etc. Textures in this mode increase their resolution from 1K to 2K pixels, something especially notable in the more than doubled memory bandwidth usage per frame. There are more than twice as many global illumination light probes throughout the workload, added particle fire and smoke effects, lightshafts, a higher quality bloom and depth of field effect, and finally more lights are shadow mapped.
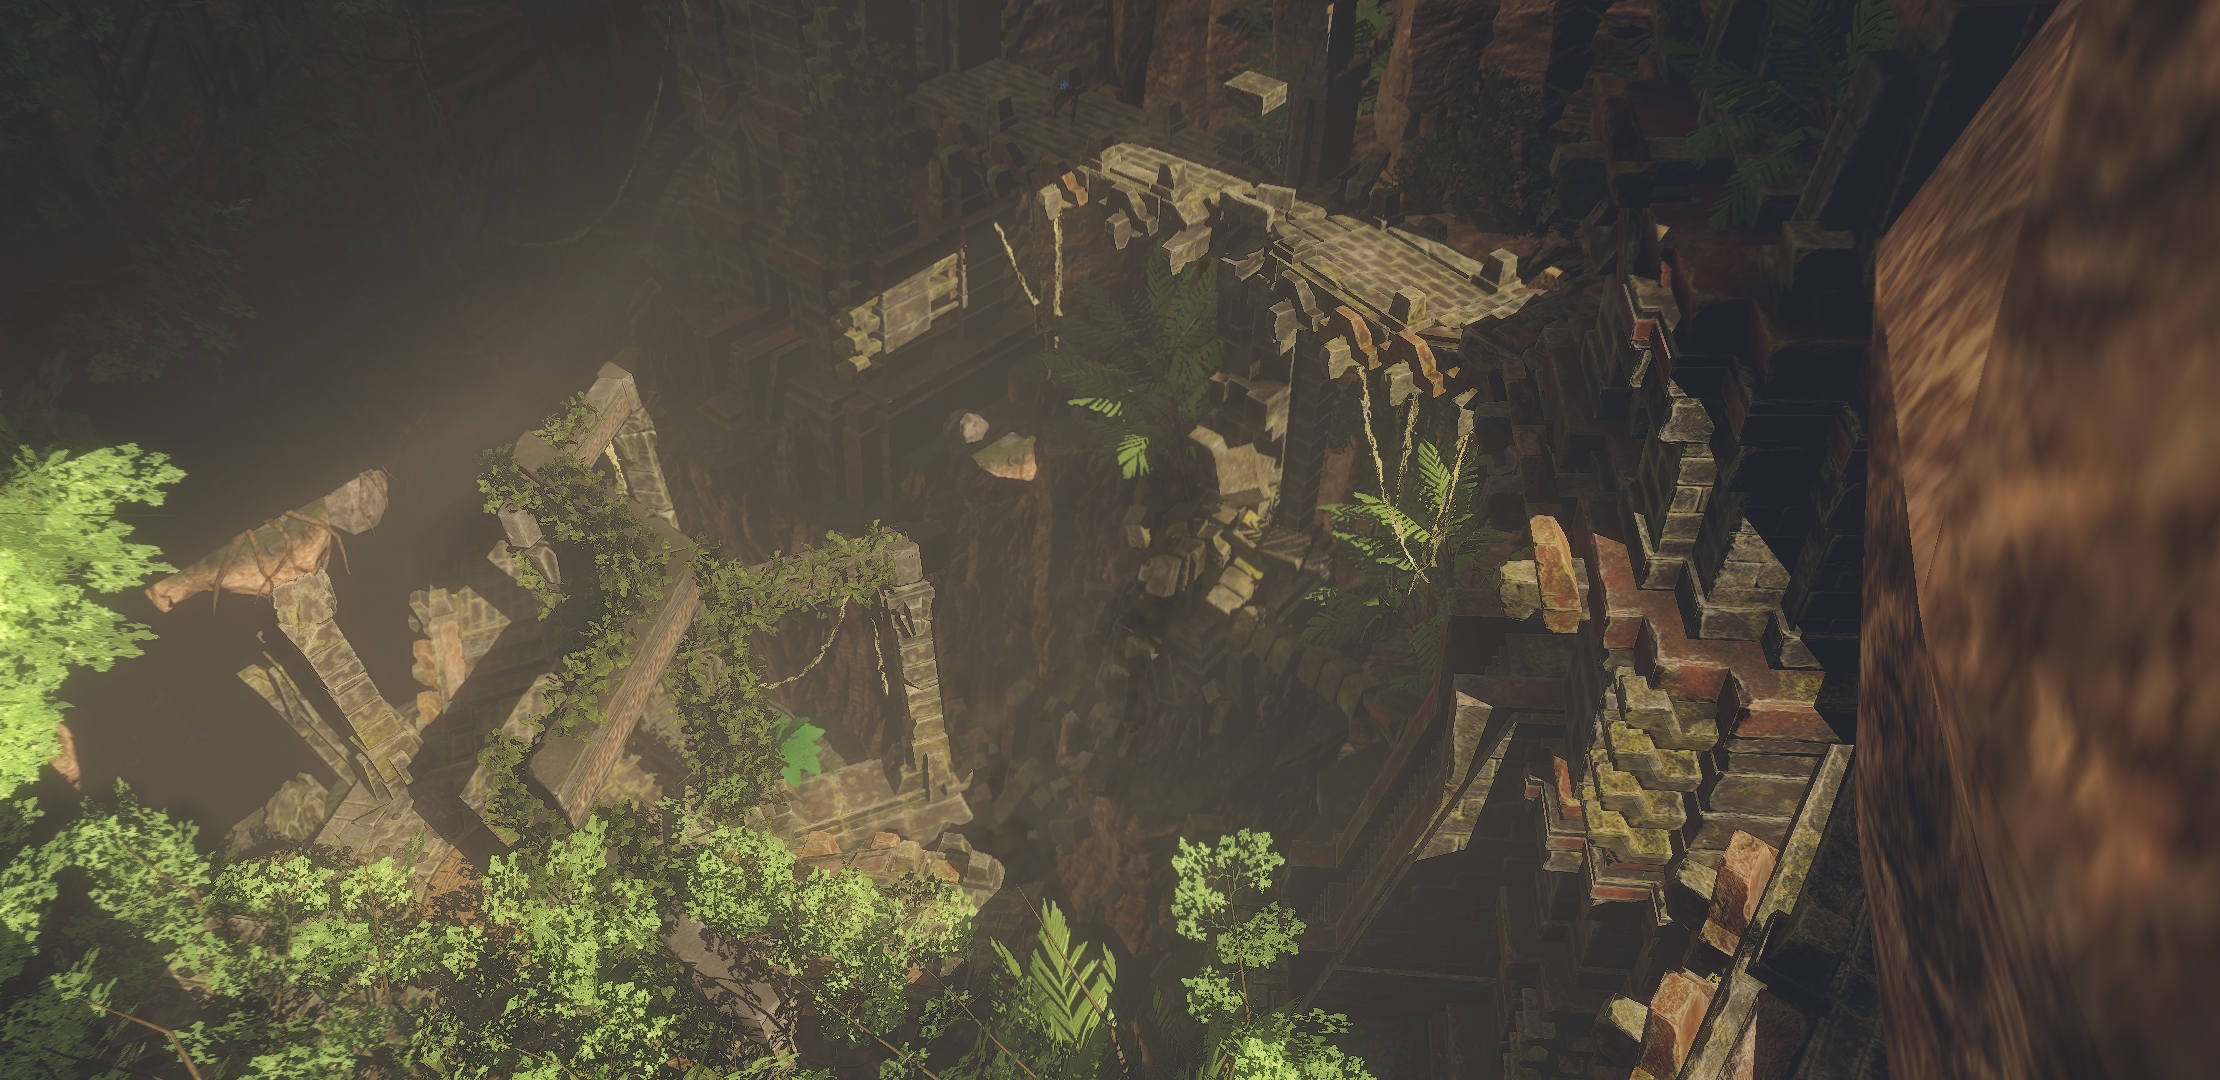
The end result for the High mode are that it more than doubles the average geometry complexity to up to 440K triangles per frame, and again increases the amount of shader work per pixel by 27%, reaching an average of 161%. In actual numbers, because the High mode runs at a default 1440p, this more than doubles the amount of shader compute power required.
Benchmark Results
When looking at overall benchmark workload complexity over the GFXBench tests over the years, we see an increasing trend of more shader heavy workloads. Here T-Rex’s fragment shader workload is still relatively low at only 31% of the rasterised pixels, but has a quite higher geometry throughput requirement than even still the newest Aztec Ruins in High mode. Here performance is very much fill-rate limited, and is actually still a good representation of a lot of today’s games, as compute-heavier titles becoming more and more common over the years.
Overall, the new Aztec tests continue down the road of ever more shader-heavy and compute requiring workloads, something that is being overall reflected in actual game titles in the industry.
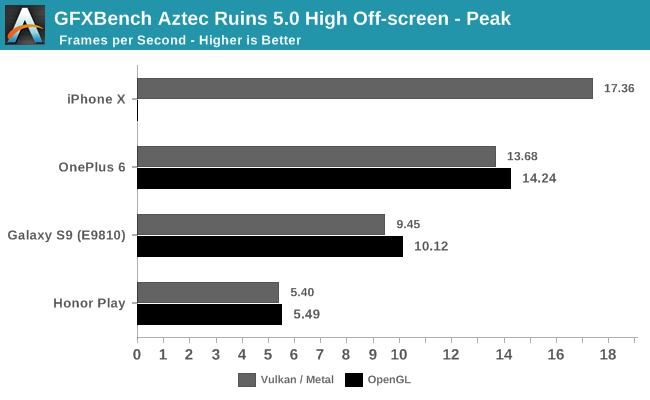
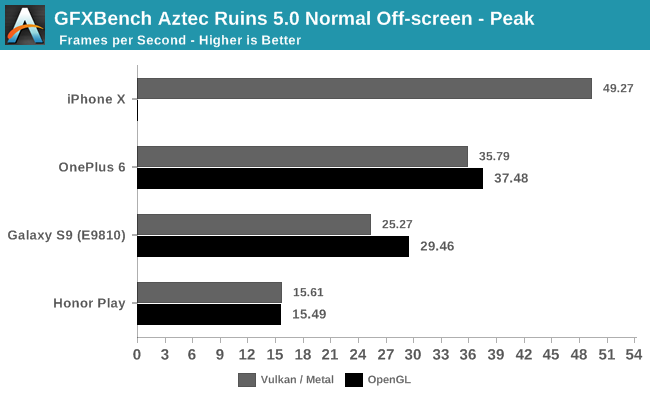
Testing out the new benchmark on the four current flagship SoCs gives us a better idea of the new performance characteristics the new benchmarks showcases for the various GPU architectures. The iPhone X is powered by the A11 SoC and a customised GPU. The OnePlus 6 offers the Snapdragon 845 and the high-performing Adreno 630, while both the Galaxy S9 and Honor Play use Arm’s Mali G72 GPU, but implemented differently across the Exynos 9810 and Kirin 970.
Unfortunately because Apple is deprecating OpenGL, we don’t have an API comparison on the iPhone X. Nevertheless, we’re presented with excellent peak performance by the A11 GPU, although the phone gets noticably hot even after one run.
The OnePlus 6 leads the Android pack, increasing the gap between the Adreno 630 and the top-performing Mali GPUs. Here the Adreno’s raw theoretical specs at 727 GFLOPs almost double the 370 GFLOPs of the Exynos 9810’s Mali G72MP18. In ever increasingly computationally heavy workloads, the Adreno is able to showcase this power, while the Malis do better in keeping up in less shader demanding workloads such as T-Rex.
Conclusion
Overall, the new Aztec tests try to predict the industry trend towards more computationally heavy games, while also increasing all other performance requirement knobs. With the current strongest performance GPUs peaking at 10-17fps in the High tier mode, hopefully the benchmark will serve as a steady mainstay in our benchmark suite for a couple of years to come. We’ll be including more results such as sustained performance figures in our future mobile reviews.


40 Comments
View All Comments
eastcoast_pete - Friday, August 24, 2018 - link
I like the idea of the Aztec Ruins on High settings as the new yardstick. With the current generation top mobile GPUs getting about 14-18 fps, it gives the GPU teams of SoC makers something to aim for. Who'll be the first the crack 30fps on Aztec Ruins, High Setting? A12? Snapdragon 855? The new Kirin?tipoo - Saturday, August 25, 2018 - link
50% scaling on the A11 would be a 25fps peak, close but not quite, and that's also the peak number and not average. So I think at least two generations more for 30fps average.Vince789 - Sunday, August 26, 2018 - link
Might just be 6 months if we get LPDDR5 and a 4 core Adreno 640 (the Adreno 630 is 2 cores) in the 855The A12 should come pretty close if they use a 5 core GPU
lucam - Friday, August 24, 2018 - link
It seems that PowerVR still the fastest solution in this benchmark.mode_13h - Friday, August 24, 2018 - link
I was just struck by the irony that PowerVR isn't actually in any of the current standalone VR HMDs.What about AR? Magic Leap is using Nvidia. Is everyone else using Qualcomm/Adreno?
lucam - Saturday, August 25, 2018 - link
I am referring to IPad Pro (2017) and IPhone XZolaIII - Saturday, August 25, 2018 - link
It's not in any VR, it's supposedly faster thanks to Metal API while everything else still has rather bad (regarding performance) Vulkan driver's. Not only PowerVR is still competitive but only one who could stand up against Nv with RT as they had a unit for it way back before. Unfortunately I don't believe new owners are bright enough to capitalise on advantage they got.lucam - Saturday, August 25, 2018 - link
Which is a shame indeed...Vince789 - Saturday, August 25, 2018 - link
I'd wait for sustained performance numbers before jumping to conclusionse.g. in Manhatten 3.1 the A11 drops ~41% vs ~15% on the 845 (see Andrei's S9 review)
If we assume the same drop for this benchmark
High OP6 sustained: 12.05 fps
High iPhone X sustained: 10.26 fps
Normal OP6 sustained: 31.71 fps
Normal iPhone X sustained: 29.12 fps
ZolaIII - Sunday, August 26, 2018 - link
Well to make this even remotely exact it would need to be done on the given DTP for all SoC's & on the same API, normalised; average & sustained frame rates. Which ain't going to happen ever. New android's like One + 6 manage tu keep higher sustained performance thanks to better cooling & higher DTP. Both Imagination and QC scaled their clusters up increasing their scaling performance as less clusters scale better while ARM is still playing catch up (but rather fast). Still the fact remains how Imagination is closest up to date to be competitive to QC Adrenos in efficiency & QC is leading the pact still ahead of Nv (in relative performance as mobile GPU's are very small compared to the desktop one's).