The AMD Ryzen 9 3950X Review: 16 Cores on 7nm with PCIe 4.0
by Dr. Ian Cutress on November 14, 2019 9:00 AM ESTCPU Performance: System Tests
Our System Test section focuses significantly on real-world testing, user experience, with a slight nod to throughput. In this section we cover application loading time, image processing, simple scientific physics, emulation, neural simulation, optimized compute, and 3D model development, with a combination of readily available and custom software. For some of these tests, the bigger suites such as PCMark do cover them (we publish those values in our office section), although multiple perspectives is always beneficial. In all our tests we will explain in-depth what is being tested, and how we are testing.
All of our benchmark results can also be found in our benchmark engine, Bench.
Application Load: GIMP 2.10.4
One of the most important aspects about user experience and workflow is how fast does a system respond. A good test of this is to see how long it takes for an application to load. Most applications these days, when on an SSD, load fairly instantly, however some office tools require asset pre-loading before being available. Most operating systems employ caching as well, so when certain software is loaded repeatedly (web browser, office tools), then can be initialized much quicker.
In our last suite, we tested how long it took to load a large PDF in Adobe Acrobat. Unfortunately this test was a nightmare to program for, and didn’t transfer over to Win10 RS3 easily. In the meantime we discovered an application that can automate this test, and we put it up against GIMP, a popular free open-source online photo editing tool, and the major alternative to Adobe Photoshop. We set it to load a large 50MB design template, and perform the load 10 times with 10 seconds in-between each. Due to caching, the first 3-5 results are often slower than the rest, and time to cache can be inconsistent, we take the average of the last five results to show CPU processing on cached loading.
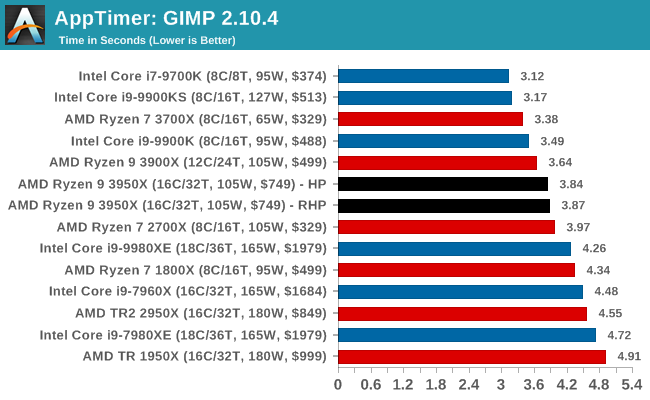
As a raw single threaded test, we see Intel's high 5.0 GHz CPUs near the top. The Ryzen 3700X and Ryzen 3900X beats the 3950X here by small margins, perhaps due to memory traffic or the complexity of dealing with more cores in the system. However the Ryzen 9 3950X sails past Intel's HEDT chips.
3D Particle Movement v2.1: Brownian Motion
Our 3DPM test is a custom built benchmark designed to simulate six different particle movement algorithms of points in a 3D space. The algorithms were developed as part of my PhD., and while ultimately perform best on a GPU, provide a good idea on how instruction streams are interpreted by different microarchitectures.
A key part of the algorithms is the random number generation – we use relatively fast generation which ends up implementing dependency chains in the code. The upgrade over the naïve first version of this code solved for false sharing in the caches, a major bottleneck. We are also looking at AVX2 and AVX512 versions of this benchmark for future reviews.
For this test, we run a stock particle set over the six algorithms for 20 seconds apiece, with 10 second pauses, and report the total rate of particle movement, in millions of operations (movements) per second. We have a non-AVX version and an AVX version, with the latter implementing AVX512 and AVX2 where possible.
3DPM v2.1 can be downloaded from our server: 3DPMv2.1.rar (13.0 MB)
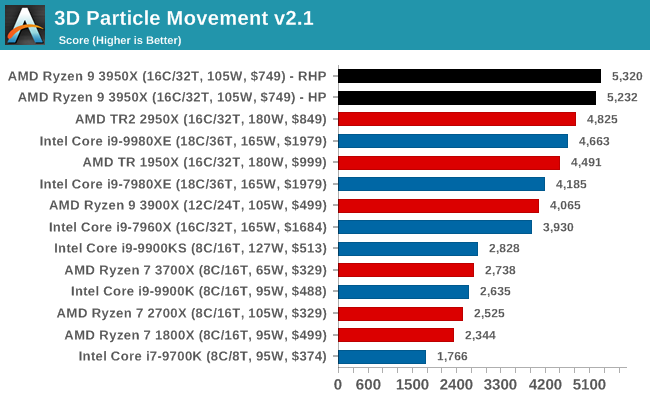
For some simple math without AVX acceleration, the 3950X piles on the core performance and IPC to give our best results, above and beyond what the Core i9-9980XE can provide for less power at under half the cost.
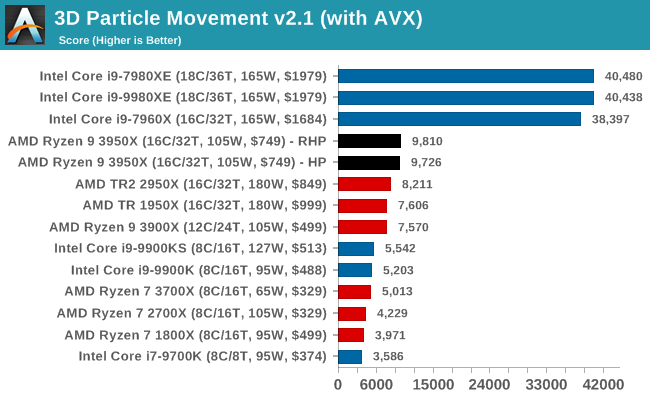
However, this is one benchmark where ratcheting in AVX2 and AVX512 really helps. There's no escaping the Intel HEDT family here, but on AVX2 mode AMD wins the best of the rest.
Dolphin 5.0: Console Emulation
One of the popular requested tests in our suite is to do with console emulation. Being able to pick up a game from an older system and run it as expected depends on the overhead of the emulator: it takes a significantly more powerful x86 system to be able to accurately emulate an older non-x86 console, especially if code for that console was made to abuse certain physical bugs in the hardware.
For our test, we use the popular Dolphin emulation software, and run a compute project through it to determine how close to a standard console system our processors can emulate. In this test, a Nintendo Wii would take around 1050 seconds.
The latest version of Dolphin can be downloaded from https://dolphin-emu.org/
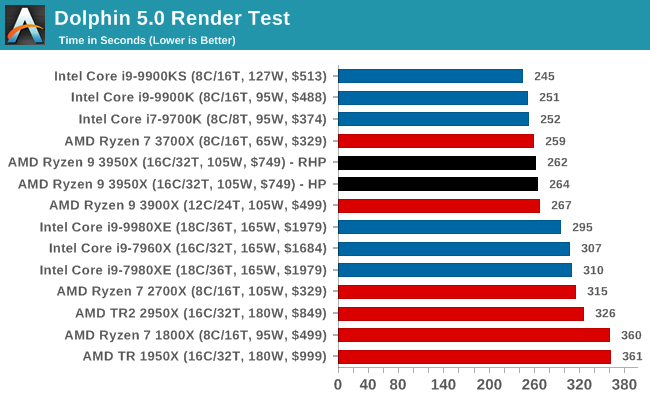
Dolphin is another ST test, and Intel's 4.7+ GHz family are ahead of AMD here. The 3700X is a smidgen ahead of the 3950X, perhaps due to having only one chiplet rather than two.
DigiCortex 1.20: Sea Slug Brain Simulation
This benchmark was originally designed for simulation and visualization of neuron and synapse activity, as is commonly found in the brain. The software comes with a variety of benchmark modes, and we take the small benchmark which runs a 32k neuron / 1.8B synapse simulation, equivalent to a Sea Slug.
Example of a 2.1B neuron simulation
We report the results as the ability to simulate the data as a fraction of real-time, so anything above a ‘one’ is suitable for real-time work. Out of the two modes, a ‘non-firing’ mode which is DRAM heavy and a ‘firing’ mode which has CPU work, we choose the latter. Despite this, the benchmark is still affected by DRAM speed a fair amount.
DigiCortex can be downloaded from http://www.digicortex.net/
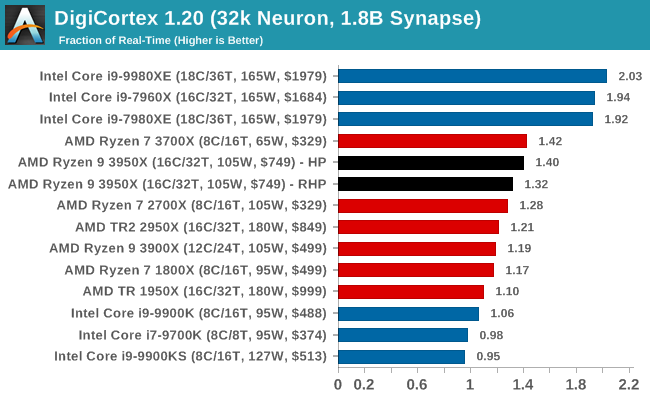
DigiCortex likes memory channels, and so Intel's HEDT chips win here. Again we see the 3700X beating the 3950X, likely due to the available bandwidth per core being higher and more cores not making much of a difference in performance.
y-Cruncher v0.7.6: Microarchitecture Optimized Compute
I’ve known about y-Cruncher for a while, as a tool to help compute various mathematical constants, but it wasn’t until I began talking with its developer, Alex Yee, a researcher from NWU and now software optimization developer, that I realized that he has optimized the software like crazy to get the best performance. Naturally, any simulation that can take 20+ days can benefit from a 1% performance increase! Alex started y-cruncher as a high-school project, but it is now at a state where Alex is keeping it up to date to take advantage of the latest instruction sets before they are even made available in hardware.
For our test we run y-cruncher v0.7.6 through all the different optimized variants of the binary, single threaded and multi-threaded, including the AVX-512 optimized binaries. The test is to calculate 250m digits of Pi, and we use the single threaded and multi-threaded versions of this test.
Users can download y-cruncher from Alex’s website: http://www.numberworld.org/y-cruncher/
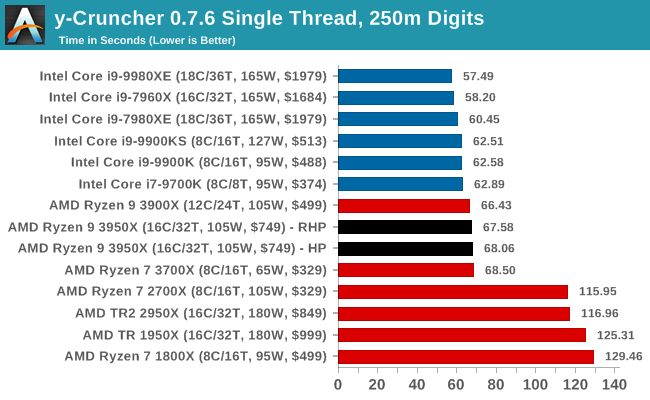
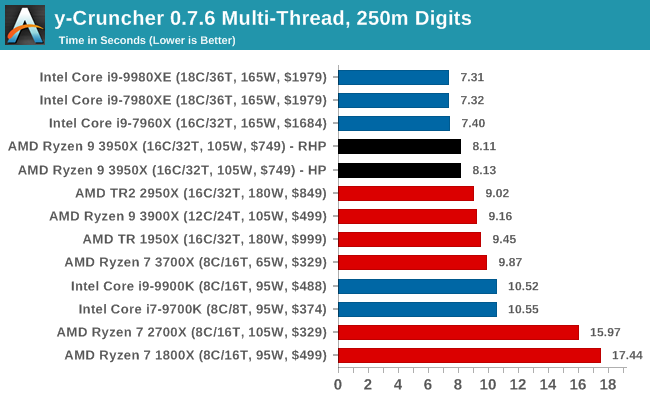
y-Cruncher is another piece of software that can use AVX-512, but AMD still comes very close. For single threadeded AVX2, the 5.0 GHz CPUs from Intel have a small lead, but in multi-threaded AVX2 the 16-cores with Zen 2 allow AMD to power through Intel's maintream offerings by 25%.
Agisoft Photoscan 1.3.3: 2D Image to 3D Model Conversion
One of the ISVs that we have worked with for a number of years is Agisoft, who develop software called PhotoScan that transforms a number of 2D images into a 3D model. This is an important tool in model development and archiving, and relies on a number of single threaded and multi-threaded algorithms to go from one side of the computation to the other.
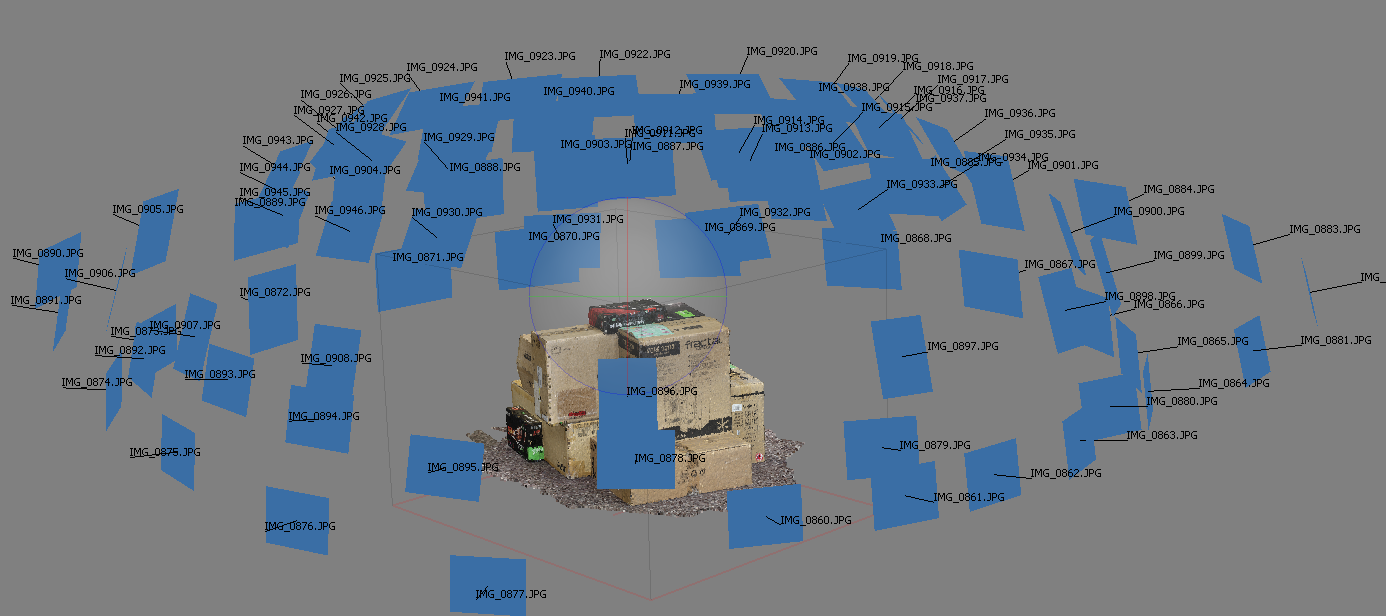
In our test, we take v1.3.3 of the software with a good sized data set of 84 x 18 megapixel photos and push it through a reasonably fast variant of the algorithms, but is still more stringent than our 2017 test. We report the total time to complete the process.
Agisoft’s Photoscan website can be found here: http://www.agisoft.com/
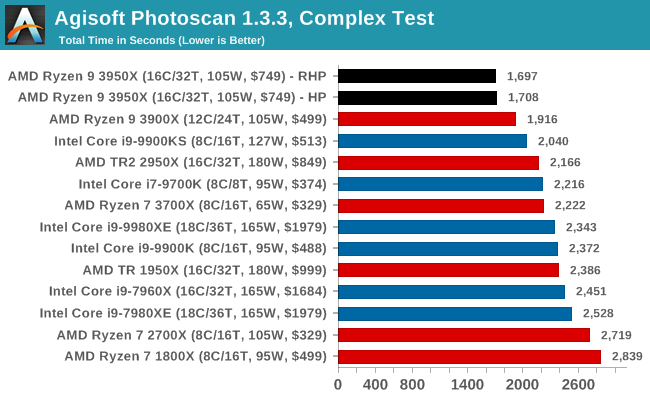
This variable threaded workload shows the power of AMD's 16 Zen 2 cores at a high frequency. Despite 5.0 GHz all-core turbo being on the 9900K, only having 8 cores lets it down here. Intel's HEDT line of processors just don't have the per-core performance to keep up.


206 Comments
View All Comments
Devo2007 - Thursday, November 14, 2019 - link
First page "As we move into 2019" - should be "As we move into 2020"plp1980 - Thursday, November 14, 2019 - link
Is says as we move "through" not as we move "into"Ryan Smith - Thursday, November 14, 2019 - link
It did originally say "into". We've since fixed it.=)Netmsm - Friday, November 15, 2019 - link
Ryan, why isn't there any Cinebench test?!TheJian - Wednesday, November 20, 2019 - link
Because nobody uses it as Intel said (nobody is 1% or less right?)? Nobody making money is using something that is far slower that PAID products. Pointless to benchmark this in every review, just like it's pointless to test 4k in all vid card reviews when nobody is using that either (ok, nobody here means less than 2%...LOL). Whatever. Surely Ryan is chomping at the bit now to tell me 4k is the new enthusiast standard...LOL. Yeah, wake me when 1440p is, as it still isn't LONG after you said that at 660ti article. Still not even 5% years later, heck, both added up don't hit 7% last I checked (month ago?). 1080p however? 65% of users of 130mil steam gamers (this is pretty accurate for the world elsewhere no doubt). Should test LOADS of 1080p games, and maybe benchmark 1/2 at 1440p, only 1-2 at 4k if at all (should be done once a year or in a separate review of 4k yearly?). Until people use it, quit wasting time.Anandtech (and many others) seem to do a lot of testing that is NOT how a user would do use their PC. Handbrake crap quality etc. Who uses FAST? FASTER? You blind already so blur doesn't matter? Cinebench freeware same story. Intel seems to have a point though they didn't mind before losing massively on all these things they are now whining about.
https://store.steampowered.com/hwsurvey/Steam-Hard...
Yep, still right, not even 5% yet for 1440p, 7% accurate total 4k+1440p still...LOL. Keep dreaming ryan ;)
Netmsm - Sunday, November 24, 2019 - link
impertinent words! These are not the answer.Everybody who works on editing films knows how helpful the Cinebench tests are in specifying which CPU will be faster.
alysdexia - Thursday, November 28, 2019 - link
shall be swifterpeevee - Monday, November 25, 2019 - link
"Anandtech (and many others) seem to do a lot of testing that is NOT how a user would do use their PC."Absolutely. And all their tests get the same amount of space. Including those nobody can use or reproduce. BS all the time, like off-screen rendering, compute on Dolphin emulator, in-house 3DPM... Ancient codecs, irrelevant settings... Somebody needs to bring them back into reality.
Ian Cutress - Tuesday, March 24, 2020 - link
There is. It's in our benchmark database. www.anandtech.com/benchasking - Sunday, July 5, 2020 - link
@Ian Cutress there is significant doubt (in the form of harrasement) being expressed on the forums about your conclusion on page two of this article that the power consumption of Ryzen chips changed (went upward) between Zen+ and Zen 2. Would be interesting to see your further thoughts: https://forums.anandtech.com/threads/will-cpu-supp...