The ASRock DeskMini A300 Review: An Affordable DIY AMD Ryzen mini-PC
by Ganesh T S on April 26, 2019 8:00 AM ESTUL Benchmarks - PCMark, 3DMark, and VRMark
This section deals with a selection of the UL Futuremark benchmarks - PCMark 10, PCMark 8, 3DMark, and VRMark. While the first two evaluate the system as a whole, 3DMark and VRMark focus on the graphics capabilities.
PCMark 10
UL's PCMark 10 evaluates computing systems for various usage scenarios (generic / essential tasks such as web browsing and starting up applications, productivity tasks such as editing spreadsheets and documents, gaming, and digital content creation). We benchmarked select PCs with the PCMark 10 Extended profile and recorded the scores for various scenarios. These scores are heavily influenced by the CPU and GPU in the system, though the RAM and storage device also play a part. The power plan was set to Balanced for all the PCs while processing the PCMark 10 benchmark.
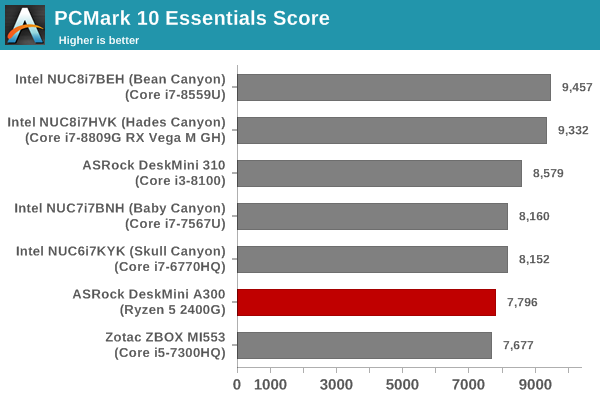
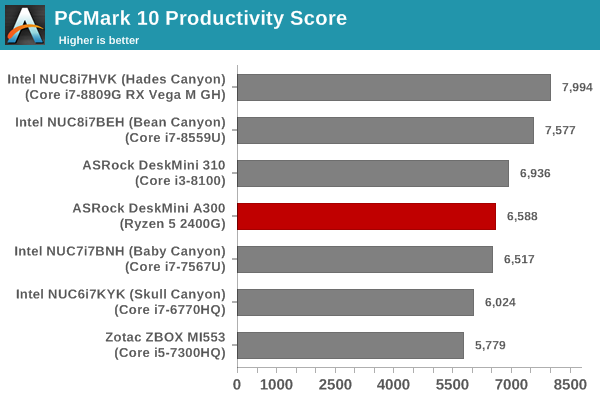
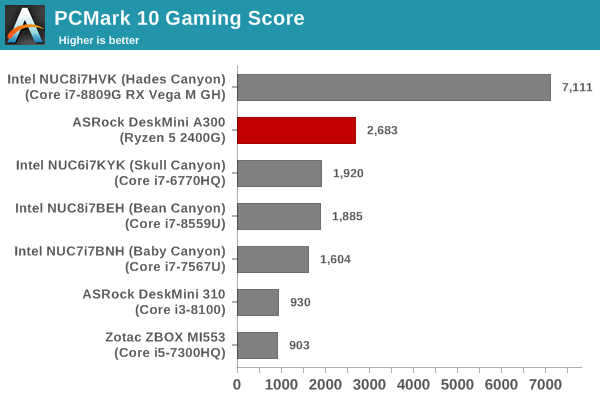
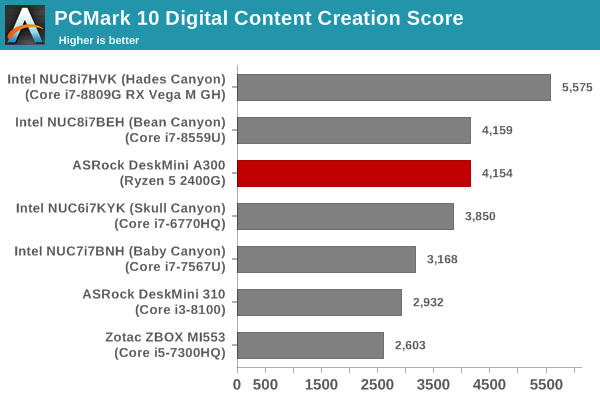
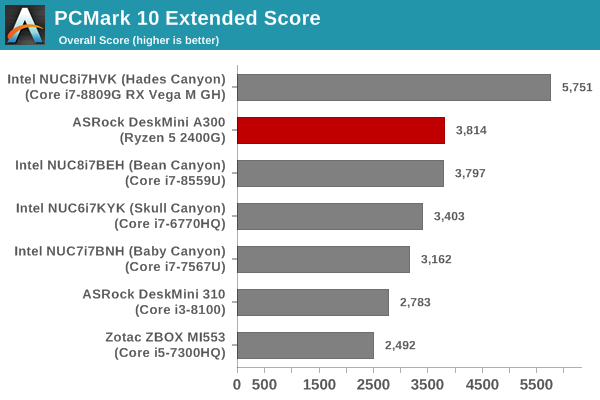
The Essentials and the Productivity scores reflect what was observed in the BAPCo SYSmark 2018 benchmarks. The higher single-threaded performance in the Core i3-8100 helps it edge ahead of the Ryzen 5 2400G. However, the gaming workload is a huge win for the DeskMini A300. The help from the multi-threaded performance also helps the system in the Digital Content Creation workload. Overall, we see the DeskMini A300 ending up with the best overall score amongst the systems without a discrete GPU.
PCMark 8
We continue to present PCMark 8 benchmark results (as those have more comparison points) while our PCMark 10 scores database for systems grows in size. PCMark 8 provides various usage scenarios (home, creative and work) and offers ways to benchmark both baseline (CPU-only) as well as OpenCL accelerated (CPU + GPU) performance. We benchmarked select PCs for the OpenCL accelerated performance in all three usage scenarios.
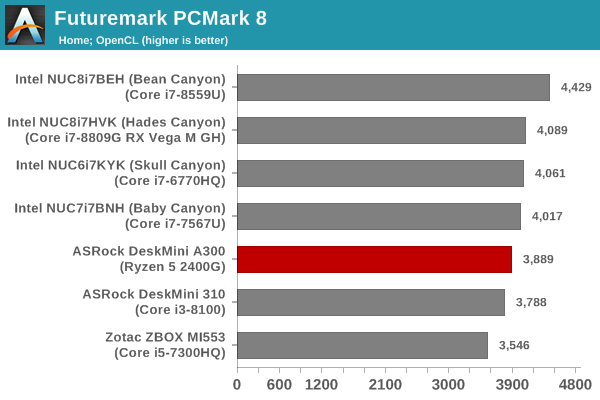
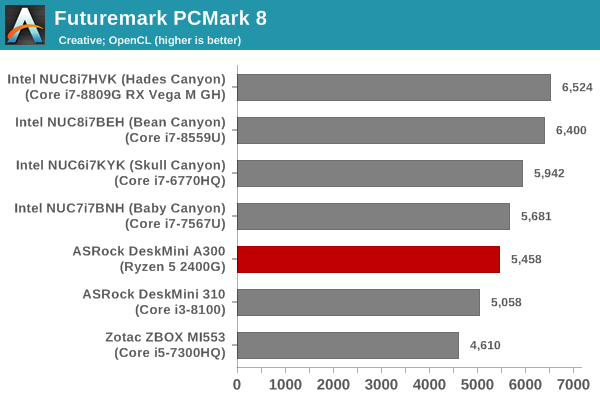
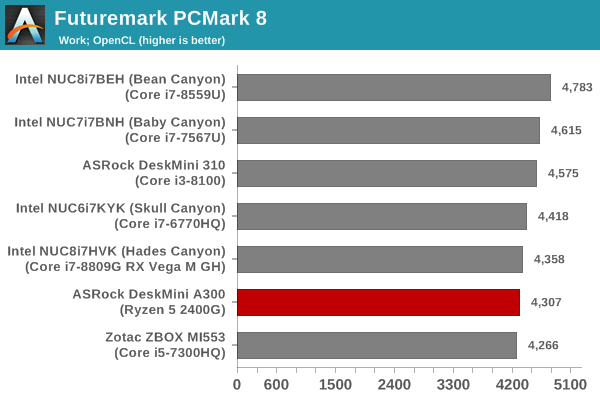
These scores are heavily influenced by the CPU in the system, and don't have a reliance on the gaming prowess to help the DeskMini A300 to get ahead. As a result, we see that the relative ordering is similar to what was observed in the BAPCo SYSmark 2018 benchmark.
3DMark
UL's 3DMark comes with a diverse set of graphics workloads that target different Direct3D feature levels. Correspondingly, the rendering resolutions are also different. We use 3DMark 2.4.4264 to get an idea of the graphics capabilities of the system. In this section, we take a look at the performance of the ASRock DeskMini A300 across the different 3DMark workloads.
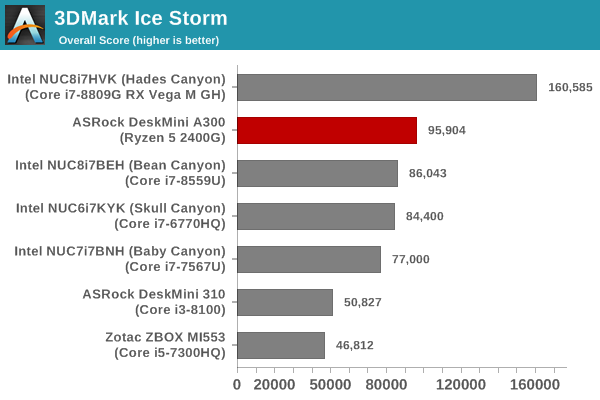
3DMark Ice Storm
This workload has three levels of varying complexity - the vanilla Ice Storm, Ice Storm Unlimited, and Ice Storm Extreme. It is a cross-platform benchmark (which means that the scores can be compared across different tablets and smartphones as well). All three use DirectX 11 (feature level 9) / OpenGL ES 2.0. While the Extreme renders at 1920 x 1080, the other two render at 1280 x 720. The graphs below present the various Ice Storm workload numbers for different systems that we have evaluated. Except for the Physics workload (CPU-reliant), the DeskMini A300 only lags behind the Hades Canyon NUC.
| UL 3DMark - Ice Storm Workloads | |||
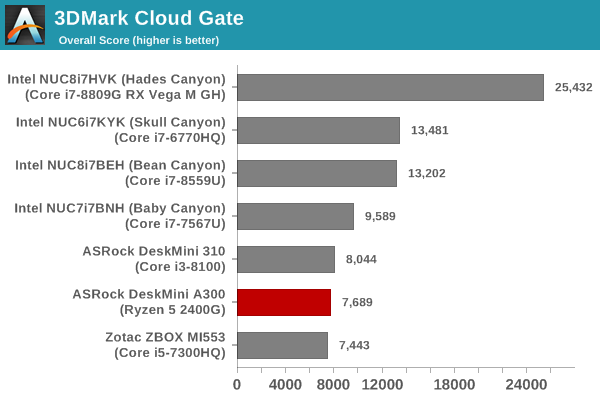
3DMark Cloud Gate
The Cloud Gate workload is meant for notebooks and typical home PCs, and uses DirectX 11 (feature level 10) to render frames at 1280 x 720. The graph below presents the overall score for the workload across all the systems that are being compared. Interestingly, the DeskMini A300 only performs as well as the DeskMini 310 for this low-complexity workload.
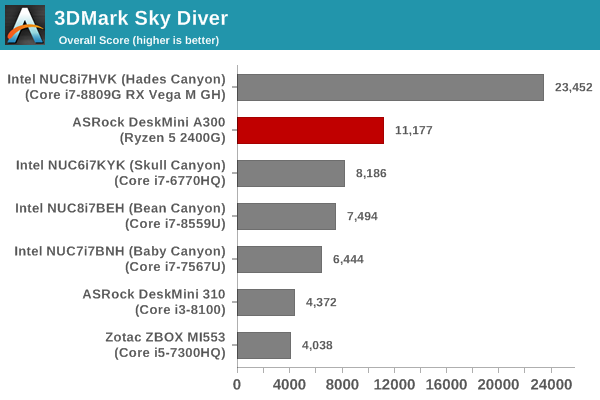
3DMark Sky Diver
The Sky Diver workload is meant for gaming notebooks and mid-range PCs, and uses DirectX 11 (feature level 11) to render frames at 1920 x 1080. The graph below presents the overall score for the workload across all the systems that are being compared. The DeskMini A300 again wins easily and turns out to be better than all other systems without a discrete GPU.
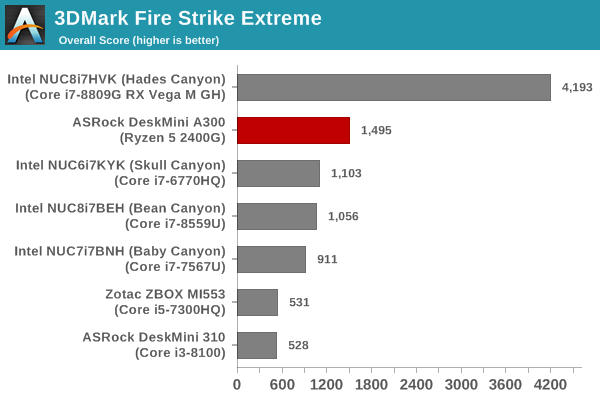
3DMark Fire Strike Extreme
The Fire Strike benchmark has three workloads. The base version is meant for high-performance gaming PCs. Similar to Sky Diver, it uses DirectX 11 (feature level 11) to render frames at 1920 x 1080. The Ultra version targets 4K gaming system, and renders at 3840 x 2160. However, we only deal with the Extreme version in our benchmarking - It renders at 2560 x 1440, and targets multi-GPU systems and overclocked PCs. The graph below presents the overall score for the Fire Strike Extreme benchmark across all the systems that are being compared. The DeskMini A300 is again the best system with an integrated GPU for this workload.
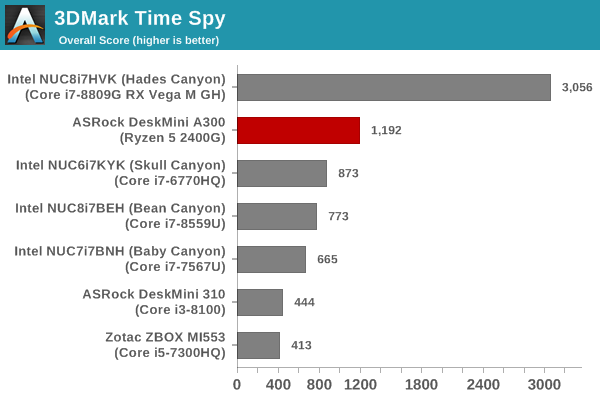
3DMark Time Spy
The Time Spy workload has two levels with different complexities. Both use DirectX 12 (feature level 11). However, the plain version targets high-performance gaming PCs with a 2560 x 1440 render resolution, while the Extreme version renders at 3840 x 2160 resolution. The graphs below present both numbers for all the systems that are being compared in this review. As expected, the DeskMini A300 is again on top (not considering systems with a discrete GPU).
| UL 3DMark - Time Spy Workloads | |||
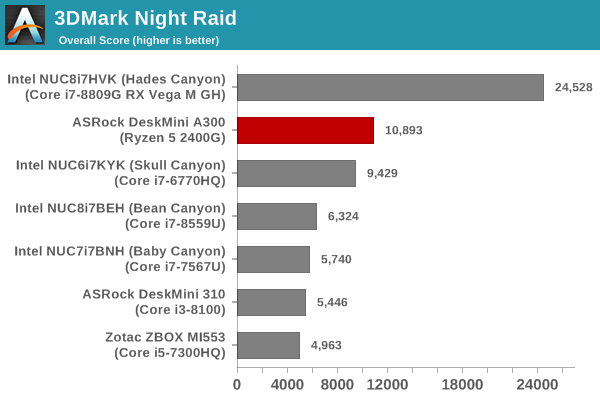
3DMark Night Raid
The Night Raid workload is a DirectX 12 benchmark test. It is less demanding than Time Spy, and is optimized for integrated graphics. The graph below presents the overall score in this workload for different system configurations.
VRMark
The DeskMini A300 is not a VR-ready PC by any stretch of imagination. However, it is still relevant to look at how the system performs for VR workloads. The VRMark Professional Edition v1.2.1701 comes with three rooms. Each room can be run either in desktop or HMD mode, with varying minimum requirements for the same workload. The benchmark results include the average FPS achieved, and a score based on the FPS. A pass or fail indicator is also provided based on whether the average FPS exceeds the required FPS. In this section, we take a look at the performance of the ASRock DeskMini A300 on a comparative basis across the three workloads in desktop mode.
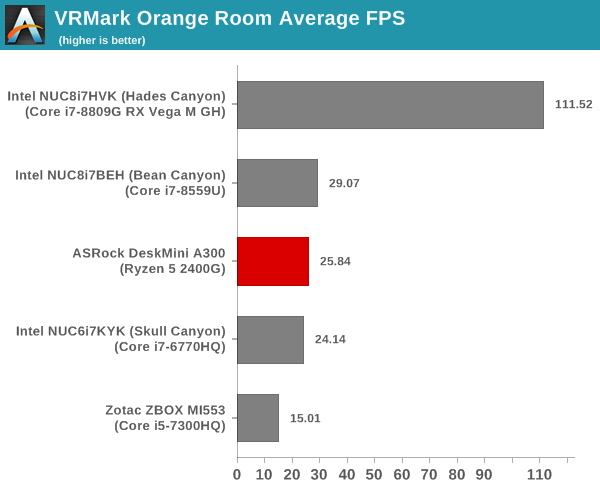
VRMark Orange Room
The Orange Room is meant to test the effectiveness of a system for handling the requirements of the HTC Vive and the Oculus Rift. The recommended hardware for both VR HMDs should be able to easily achieve the desired target FPS (88.9 fps). However, in the desktop mode, the target performance is 109 fps without any frame drops. Systems benching with an average FPS lesser than that are deemed to have failed the VRMark Orange Room benchmark. The graphs below present the average FPS and score for the different systems being considered today.
| UL VRMark - Orange Room | |||
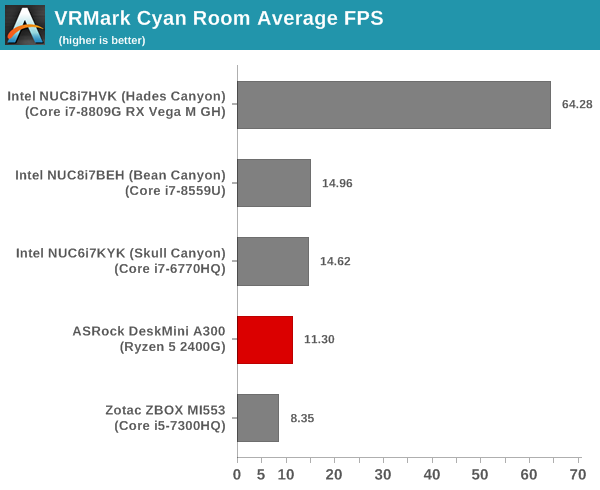
VRMark Cyan Room
The Cyan Room sits between the Orange and Blue rooms in complexity. It is a DirectX 12 benchmark. Similar to the Orange room, the target metrics are 88.9 fps on HMDs and 109 fps on the desktop monitor. The graphs below present the average FPS and score for the different systems being considered today.
| UL VRMark - Cyan Room | |||
VRMark Blue Room
The Blue Room is the most demanding of the three workloads. At the time of introduction of VRMark in October 2016, no publicly available system running as sold was able to pass the test. The performance of a system in this benchmark is an indicator of its VR-readiness for future generation of HMDs. Similar to the other workloads, the passing performance metrics are 88.9 fps on HMDs and 109 fps on desktop monitors. The complexity of the workload is due to the higher resolution (5012 x 2880) and additional geometry making it necessary to increase the number of Direct3D API calls. The graphs below present the average FPS and score for the different systems being considered today.
| UL VRMark - Blue Room | |||
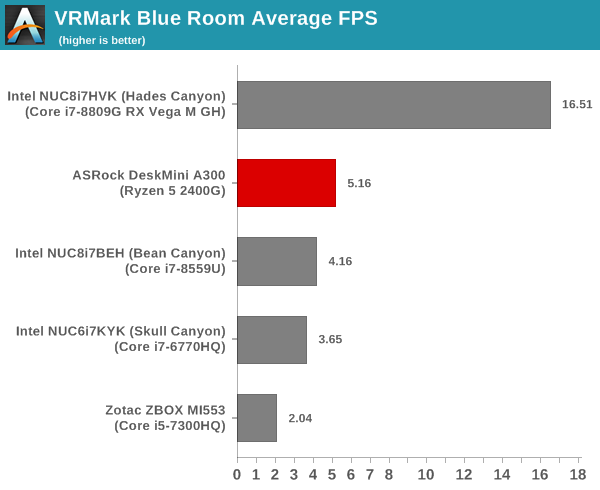
The CPU power also plays a role in the numbers for these complex workloads. So, we see that the DeskMini A300 doesn't enjoy as clear a lead as it did in the 3DMark workloads.


88 Comments
View All Comments
Thvash - Friday, April 26, 2019 - link
For some reason 4K HDR, VP9 Profile 2 is not accelerated at all under Windows, while GPU claims to support it, no such issues under LinuxSmell This - Friday, April 26, 2019 - link
**Microsoft removed the in-built HEVC decoding capabilities of Windows 10 in the 2017 Fall Creators Update, and replaced it with an extension that had to be downloaded from the Microsoft Store. Without the extension, playback is restricted to 1080p non-HDR streams encoded in H.264. In addition to the decoding capabilities, the system also needs to support PlayReady 3.0 DRM.**______________________________________
Ding!
Another drive-by DRM borking by WIntel ...
Ratman6161 - Monday, April 29, 2019 - link
This doesn't come with an OS, so if you hate Microsoft so much, then don't use Windows. As far as DRM goes, support for it is a necessary evil to avoid being sued. So it's not a "borking by Wintel", its a symptom of our lawsuit happy society + rampant piracy that the owners of intellectual property feel they must defend themselves against.mapesdhs - Thursday, May 2, 2019 - link
Wow, talk about buying MS' spin. Amazing how people are so happy to throw away their freedoms. In reality the blatant abuse of consumer IP rights is far more important but rarely addressed.https://www.youtube.com/watch?v=tUAX0gnZ3Nw
peevee - Thursday, May 2, 2019 - link
"In reality the blatant abuse of consumer IP rights"You have NO rights to OTHER PEOPLE'S Property. Intellectual or not.
ripbeefbone - Thursday, May 2, 2019 - link
I miss the 90s when nerds weren't embarassing bootlickers who fawned over corporations. get a soul you shillspeevee - Monday, May 6, 2019 - link
I was the nerd in the 90s (and 80s) and still supported patents and copyrights. While violating some of them.airider - Thursday, May 2, 2019 - link
Interesting perspective. Intellectual property is not defined anywhere. It is a made up term assigned to copyrighted material and patents. If you live in the U.S. these are protected by Article 1, Section 8, Clause 8 of the Constitution:“To promote the progress of science and useful arts, by securing for limited times to authors and inventors the exclusive right to their respective writings and discoveries.”
The "right" to IP is only guaranteed for a limited time. When this time expires, the "right" no longer exists and it becomes public domain.
airider - Thursday, May 2, 2019 - link
In fact, the reason these legal definitions exist is because copyright material and patents are not property, but rather the expression of ideas and thoughts through various forms of media (i.e. verbal, visual, etc).Because expressions are not property, a legal construct was created in order for "expressionists" to protect their ability to "make money", since once they expressed themselves, the expression is no longer their own, and the ability to profit was no longer in their control.
sorten - Tuesday, May 21, 2019 - link
I was also a nerd in the 80's (and still today) and have never thought it was cool to steal others' creations. If you do that on a large enough scale then there's no incentive left for creative types to create, and what a unhappy world that would be to create.