The Mushkin Source 500GB SATA SSD Review: A Value Proposition For An Everyday PC
by Billy Tallis on November 21, 2018 10:00 AM ESTAnandTech Storage Bench - The Destroyer
The Destroyer is an extremely long test replicating the access patterns of very IO-intensive desktop usage. A detailed breakdown can be found in this article. Like real-world usage, the drives do get the occasional break that allows for some background garbage collection and flushing caches, but those idle times are limited to 25ms so that it doesn't take all week to run the test. These AnandTech Storage Bench (ATSB) tests do not involve running the actual applications that generated the workloads, so the scores are relatively insensitive to changes in CPU performance and RAM from our new testbed, but the jump to a newer version of Windows and the newer storage drivers can have an impact.
We quantify performance on this test by reporting the drive's average data throughput, the average latency of the I/O operations, and the total energy used by the drive over the course of the test.
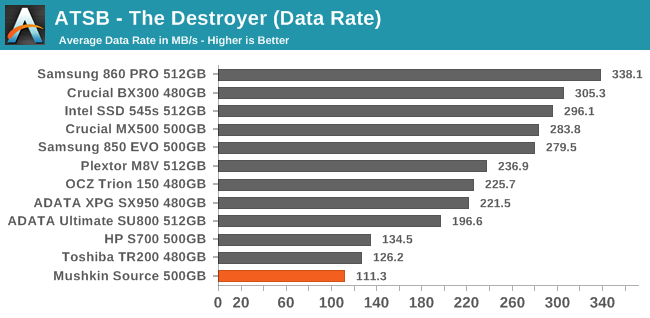
The overall performance of the Mushkin Source on The Destroyer is a step backwards from other DRAMless SSDs we've tested recently, including the HP S700 that uses an older generation of Micron 3D TLC NAND.
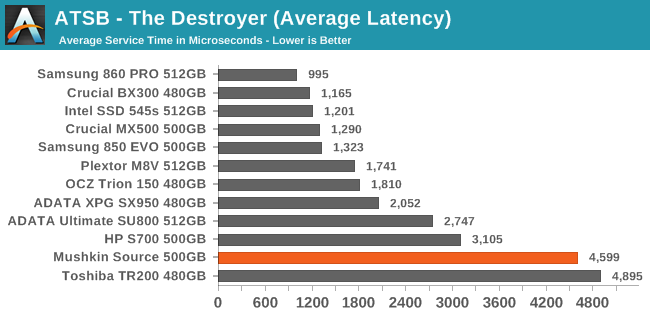
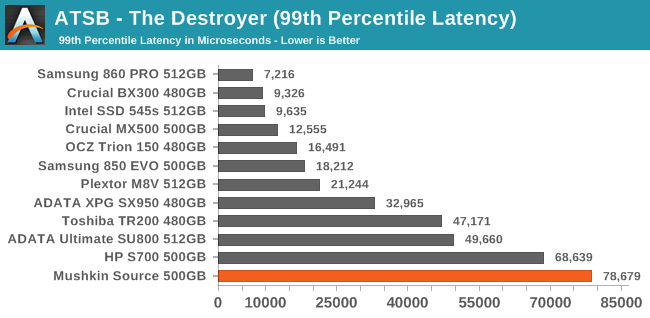
The average and 99th percentile latencies from the Mushkin Source during The Destroyer are quite high, though not unprecedented given how other DRAMless SSDs have performed. The average latency from the Mushkin Source is slightly better than the Toshiba TR200, but the 99th percentile latency is in last place among this collection of drives.
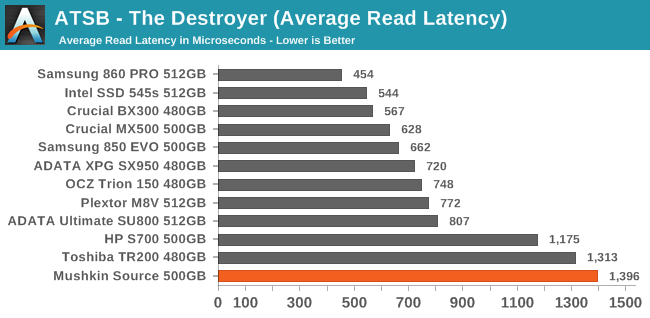
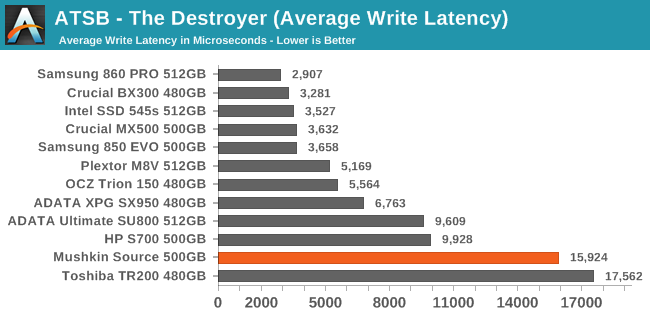
The three DRAMless drives stand out with substantially higher average read latencies than the mainstream SATA SSDs, and the Mushkin Source is the worst of the three. Average write latencies are very high for the Mushkin Source and the Toshiba TR200, but the HP S700 is only slightly worse off than the slower mainstream drives with DRAM caches.
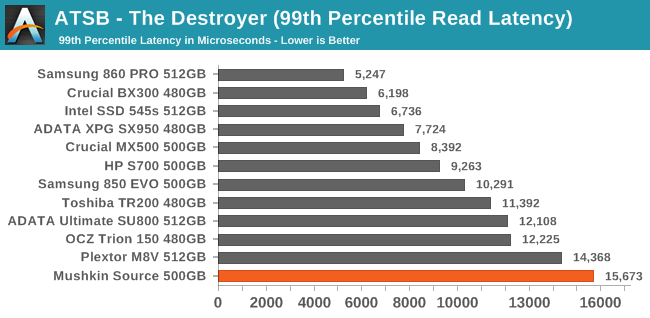
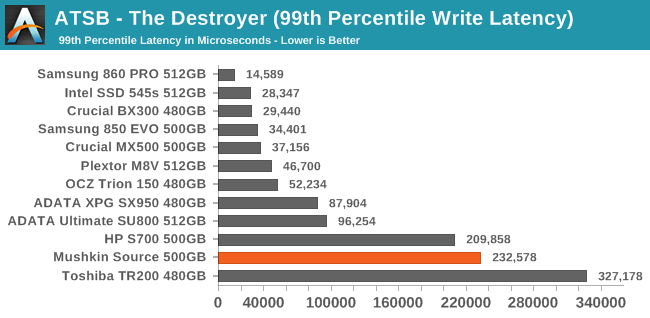
The DRAMless drives have much higher 99th percentile write latencies than the mainstream SATA drives, but the Mushkin Source's 233ms is not as bad as the 327ms from the TR200. For 99th percentile read latency, the Mushkin Source is in last place and the other two DRAMless drives have scores that are competitive with many of the mainstream drives.
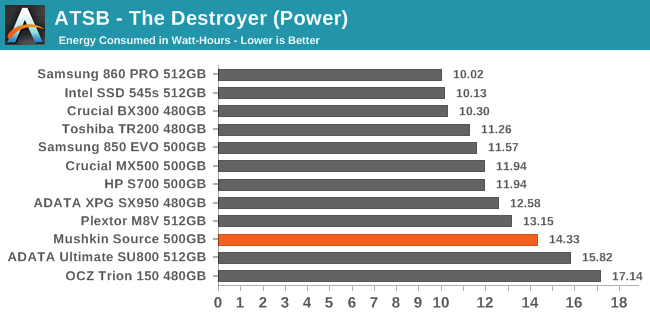
The Mushkin Source requires more energy than most SATA drives to complete The Destroyer, but some of the older mainstream drives that also have generally poor performance use even more energy. The other two DRAMless SSDs have average or slightly above average efficiency on this test despite their low performance.


30 Comments
View All Comments
benedict - Wednesday, November 21, 2018 - link
This needs to be less than 10$/GB to make any sense.deil - Wednesday, November 21, 2018 - link
it might be, wait 3-4 months from initial start. Still its cheapest 500 GB I've seen so far, and that is good sign.Small Bison - Wednesday, November 21, 2018 - link
Yeah, charging over five thousand dollars for a 500GB DRAM-less drive *does* seem like a bit much.excelle08 - Thursday, November 22, 2018 - link
Well you aren't referring to US Dollars, right?😂PeachNCream - Wednesday, November 21, 2018 - link
The scatter plots on pages 6 and 7 may benefit from the addition of color to differentiate storage types. As they stand, they're difficult to extract meaningful data from for a few reasons, but the worst offenders are too many data points in the given space and poor contrast between data types.Billy Tallis - Wednesday, November 21, 2018 - link
The purpose of those scatter plots isn't to enable comparing the highlighted drive against any particular competitor, but to show where it falls relative to the limits of what is possible/normal. The data points for the non-highlighted drives are deliberately low-contrast because their exact value or identity aren't what's important for that graph. They're supposed to blend into a cloud.PeachNCream - Wednesday, November 21, 2018 - link
Hmm, well I wasn't implying that there ought to be individual products highlighted. I was suggesting that using a categorical color in addition to the shape would help with overall visibility. For example, make TLC red, MLC green, and Optane black or something. It would allow us to extrapolate trend-like significance to the categories that were defined in the chart and position the Source among them.Great_Scott - Wednesday, November 21, 2018 - link
SSD prices are so compressed right now that I'm considering getting a Samsung 860 EVO... as the 'cheap' option.There's really no point in getting a 'budget' 2.5" form-factor drive as every brand falls within about a 10% total price range.
Ratman6161 - Wednesday, November 21, 2018 - link
Absolutely. In the SATA space, there is no reason to even look at anything other than the Samsung 860 EVO or the Crucial MX500. The 860 EVO is even cheaper than this piece of junk at the 1 TB level and only $7 less at 500 GB. There is no reason for this drive to exist unless they cut the price...a lot.heffeque - Wednesday, November 21, 2018 - link
Well the BX500 is a pretty decent drive and is somewhat cheaper than both 860EVO and MX500.