Micron M500DC (480GB & 800GB) Review
by Kristian Vättö on April 22, 2014 2:35 PM ESTPerformance Consistency
Performance consistency tells us a lot about the architecture of these SSDs and how they handle internal defragmentation. The reason we don’t have consistent IO latency with SSDs is because inevitably all controllers have to do some amount of defragmentation or garbage collection in order to continue operating at high speeds. When and how an SSD decides to run its defrag or cleanup routines directly impacts the user experience as inconsistent performance results in application slowdowns.
To test IO consistency, we fill a secure erased SSD with sequential data to ensure that all user accessible LBAs have data associated with them. Next we kick off a 4KB random write workload across all LBAs at a queue depth of 32 using incompressible data. The test is run for just over half an hour and we record instantaneous IOPS every second.
We are also testing drives with added over-provisioning by limiting the LBA range. This gives us a look into the drive’s behavior with varying levels of empty space, which is frankly a more realistic approach for client workloads.
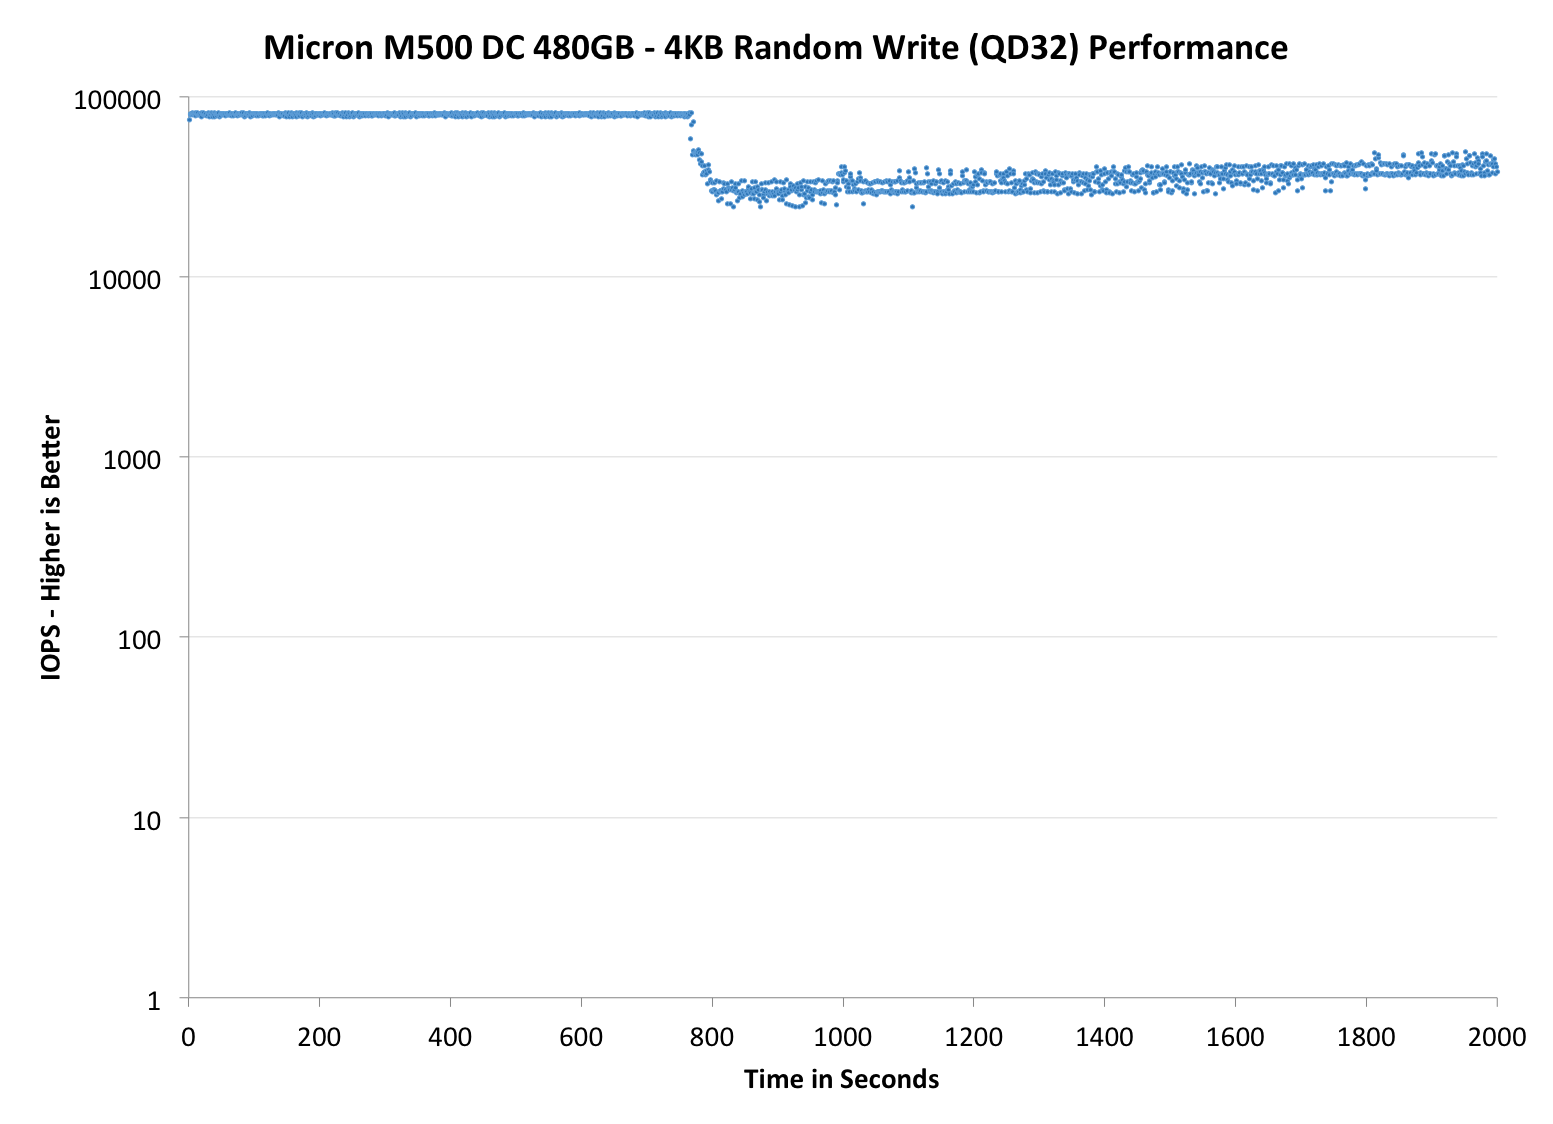
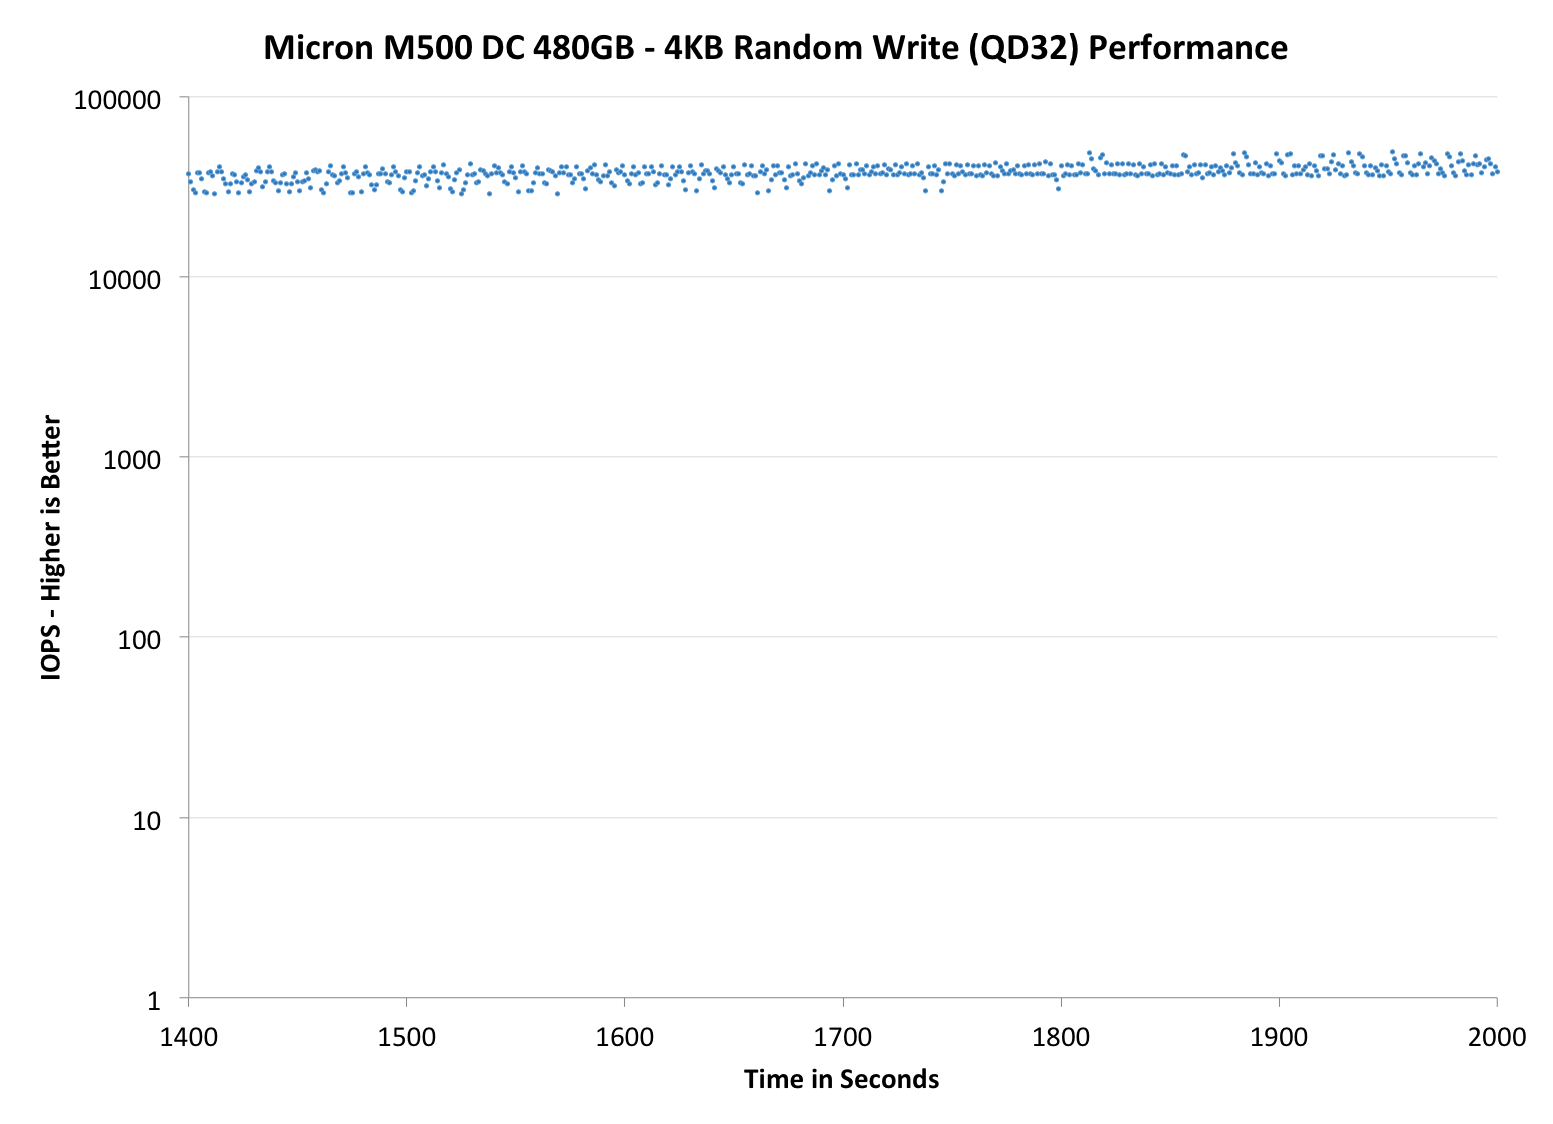
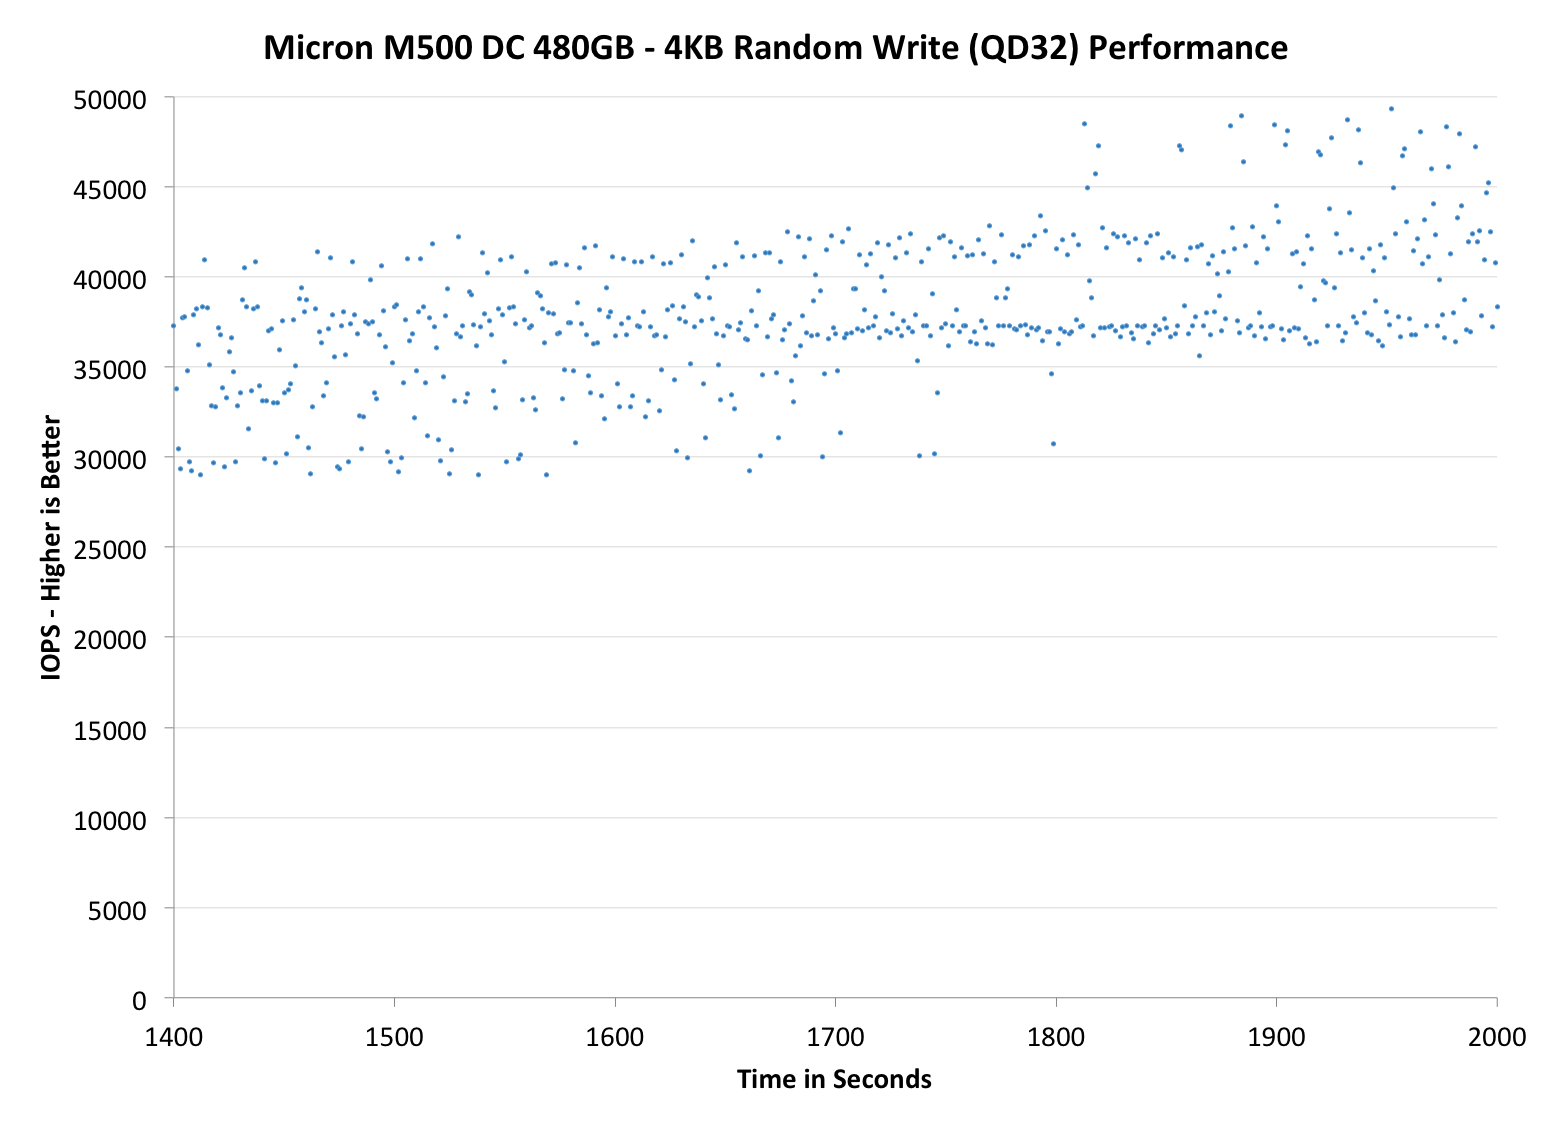
Each of the three graphs has its own purpose. The first one is of the whole duration of the test in log scale. The second and third one zoom into the beginning of steady-state operation (t=1400s) but on different scales: the second one uses log scale for easy comparison whereas the third one uses linear scale for better visualization of differences between drives. Click the buttons below each graph to switch the source data.
For more detailed description of the test and why performance consistency matters, read our original Intel SSD DC S3700 article.
 |
|||||||||
| Micron M500DC | Crucial M500 | Micron P400e | Micron P400m | Intel SSD DC S3500 | |||||
| Default |
|
||||||||
As you would expect with such hefty over-provisioning, the IO consistency is excellent. The 480GB model manages around 40K IOPS at steady-state, which is certainly one of the highest we have tested. (For the record, the Intel DC S3700 does about 33K but unfortunately there wasn't room in the table to include it.) The 800GB version doesn't do as well given its smaller over-provisioning percentage but it's relatively competitive with the 200GB P400m, which has 336GiB of NAND onboard (that's 44.6% total over-provisioning versus 27.2% in the 800GB M500DC). Compared with the P400m, the M500DC is, after all, a nice upgrade because it's able to improve IO consistency without using more over-provisioning to do that.
 |
|||||||||
| Micron M500DC | Crucial M500 | Micron P400e | Micron P400m | Intel SSD DC S3500 | |||||
| Default |
|
||||||||
 |
|||||||||
| Micron M500DC | Crucial M500 | Micron P400e | Micron P400m | Intel SSD DC S3500 | |||||
|
Default |
|
||||||||
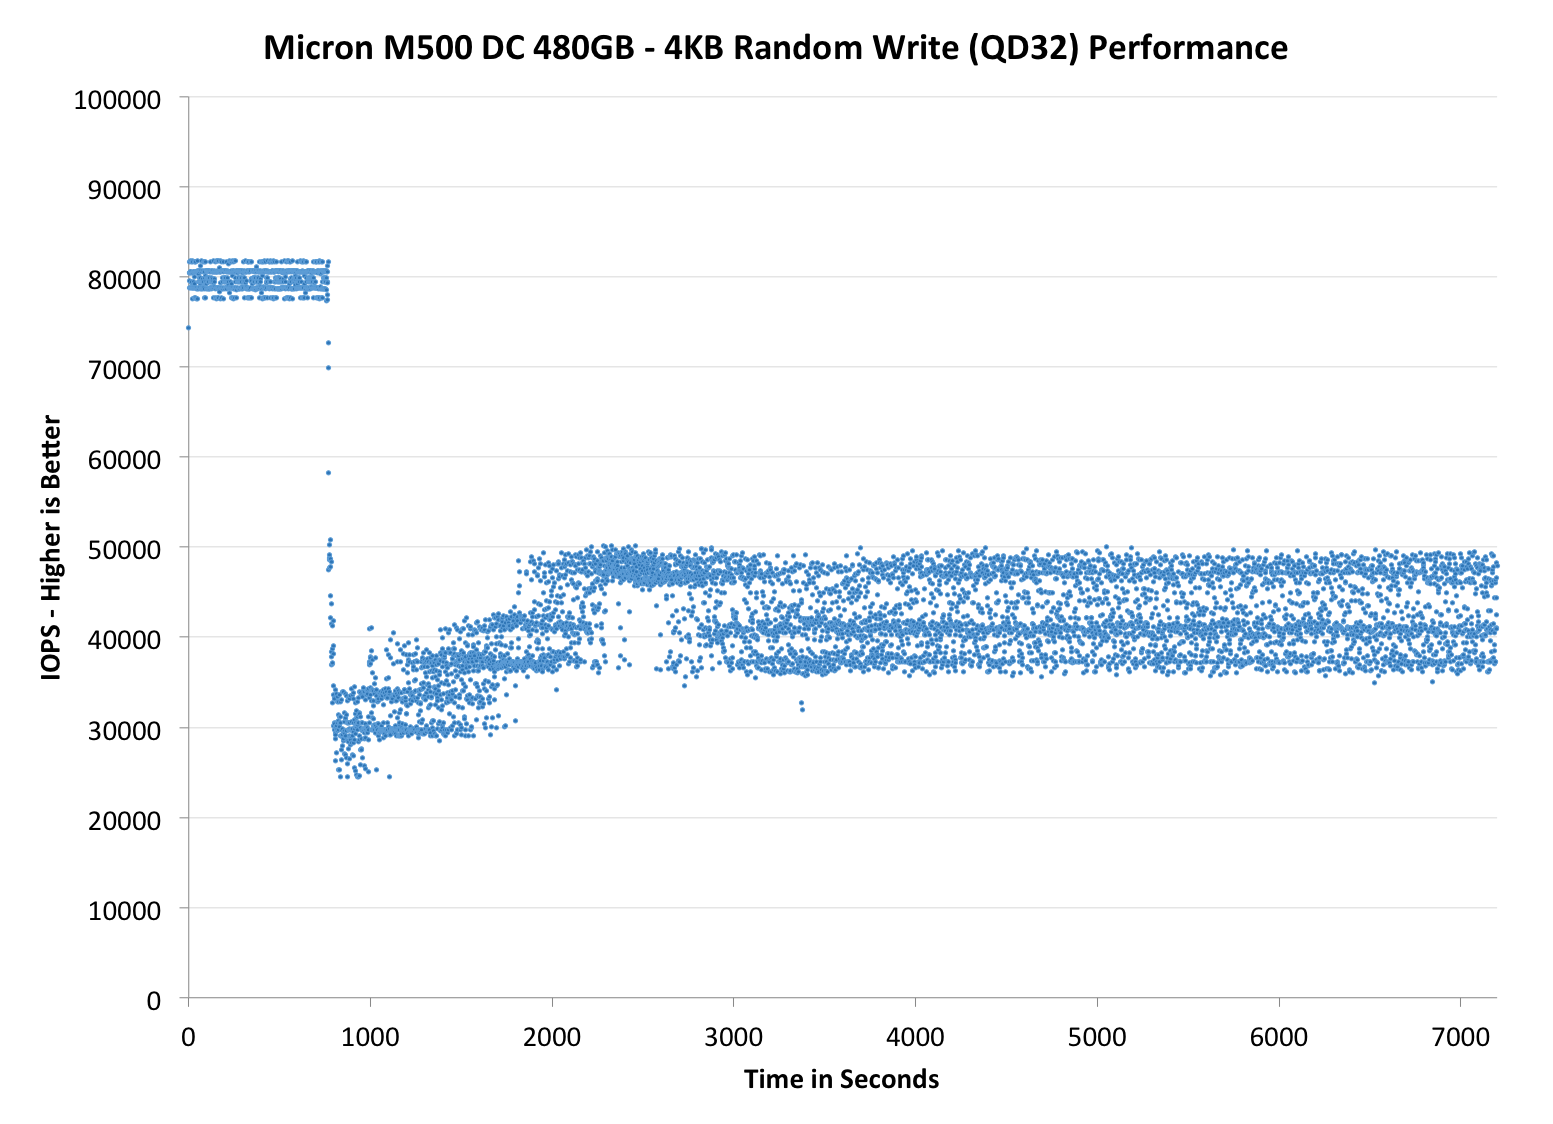
In addition to our regular performance consistency graphs, I decided to include two additional graphs that test the IO consistency over a longer period of time. For client drives, 2000 seconds is generally enough to show steady-state behavior but enterprise SSDs tend to have more over-provisioning and hence require a longer time to reach steady-state. Instead of running the test for 2000 seconds, I extended the run to 7200 seconds (i.e. two hours) while keeping everything else the same. I only have results for the M500DC drives right now, but let's see if anything changes with a longer test cycle:
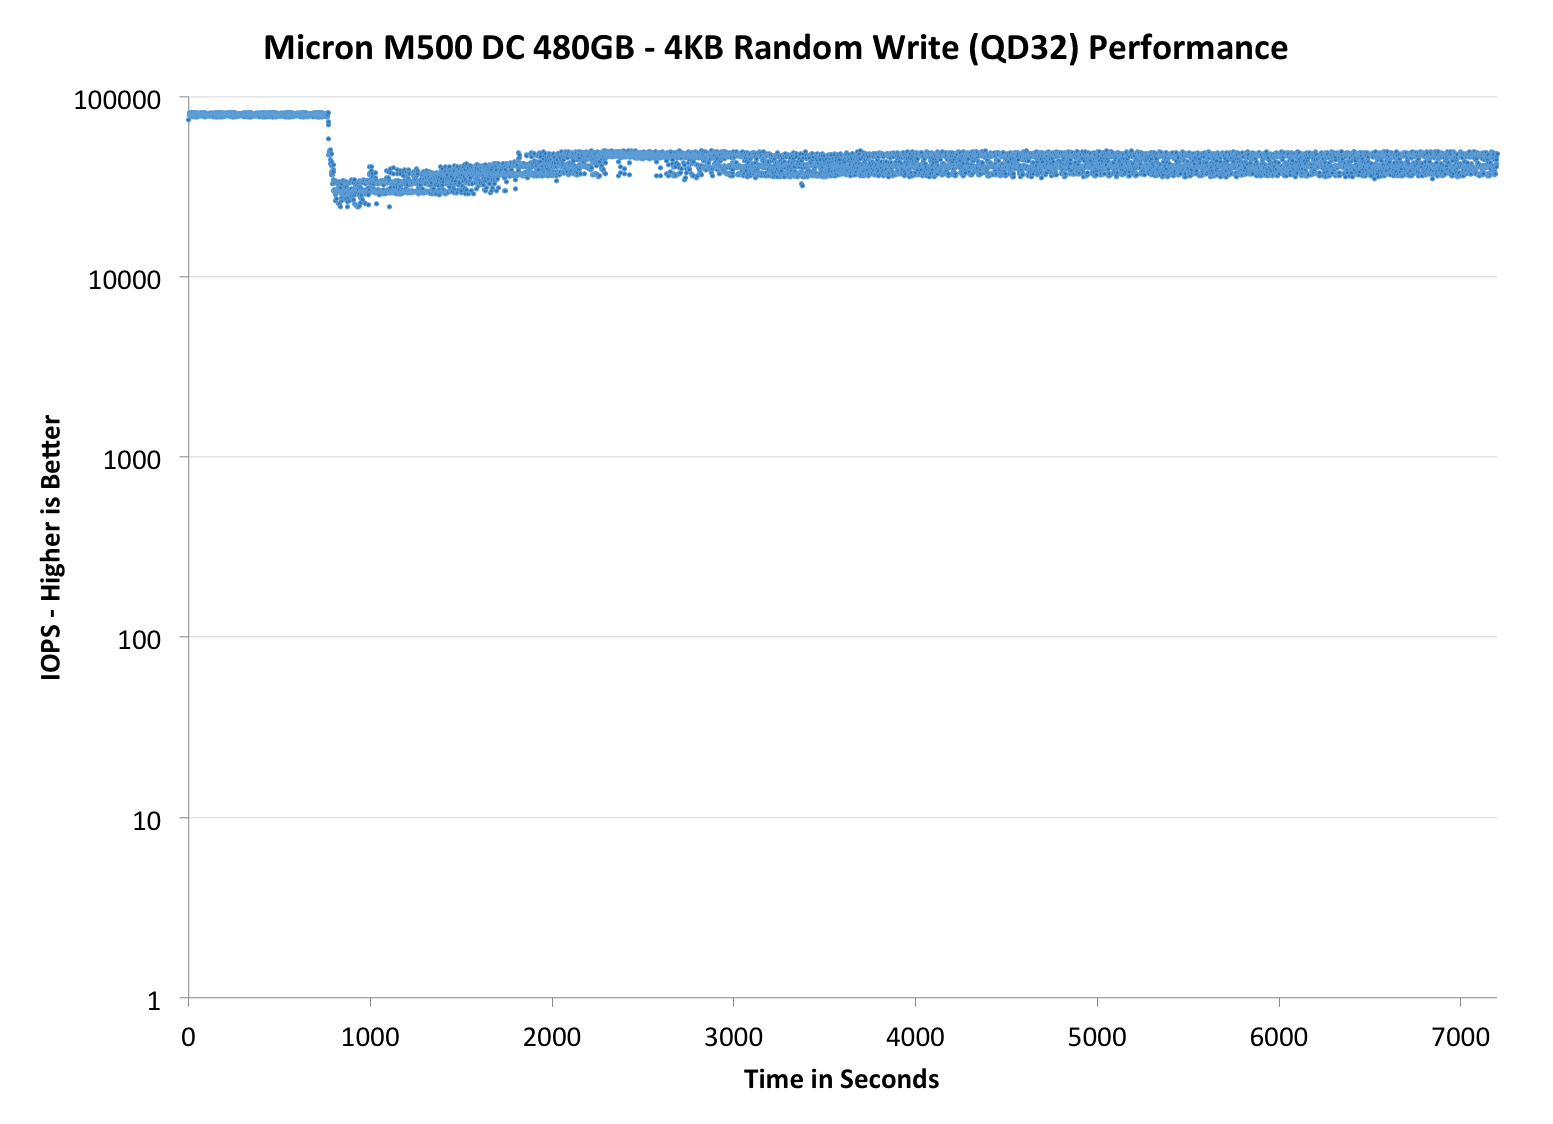
As you can see, neither of the drives show steady behavior right after 2000 seconds. In fact, it looks as though the initial trigger of data reordering drops performance and then the M500DC drives recover somewhat around the 3000 second mark, though the different amount of overprovisioning means they don't look all that similar. Unfortunately I don't have any results for other drives at this point but I'll be sure to test more drives before the next review to give you a better picture ot the M500DC's position in the market.


37 Comments
View All Comments
Samus - Wednesday, April 23, 2014 - link
I think the price is ridiculous, nearly twice as expensive as the reliable Intel S3500 and almost as expensive as the uber-superior S3700. Makes no sense.ZeDestructor - Wednesday, April 23, 2014 - link
Lot's of lack of time in some sections...Granted, new benchmarks, but IMO that should be split off to a seperate article and the entire thing delayed for publishing to get the tests done. Otherwise, excellent revewing as always.
okashira - Wednesday, April 23, 2014 - link
If you want a drive with good speed , low price and amazing endurance, just pick up a used Samsung 830 for cheap.People have tested them to 25,000 cycles. That's 10+ PB for a 512GB drive, for just $300 or less. And I suspect their data retention is superior as well.
Solid State Brain - Wednesday, April 23, 2014 - link
Thing is, while older consumer drives with quality MLC NAND might appear to have an exceptional P/E rating until failure (which occurs when wear is so high that the data retention gets so short the uncorrectable bit error rate so extreme that the controller can't keep the drive in a working state anymore, not even when powered), there's no way their manufacturer will guarantee such usage.On a related note, all consumer Samsung 840 drives (with TLC memory) I've seen pushed through in stress endurance testings posted on the internet have reached at least ~3200-3500 P/E cycles until failure and didn't start show any SMART error before 2800-2900 cycles, which means that the approximate ~1800-2000 P/E rating (for the stated TBW endurance with sequential workloads) for TLC-NAND datacenter enterprise Samsung SSDs drives (@ a 3 months data retention) makes much sense. But again, no way Samsung will offer any guarantee for such usage with consumer or workstation drives. they will just tell you they are tested for consumer/light workloads.
Real endurance figures for NAND memory in the SSD market has to be one of the industry's best kept secrets.
AnnonymousCoward - Friday, April 25, 2014 - link
Ever think of doing a real world test, measuring "time"? Everyone should know synthetic benchmarks for hard drives are meaningless. Why don't you do a roundup of drives and compare program load time, file copy time, boot time, and encoding time. Am I a freakin genius to think of this?MrPoletski - Saturday, April 26, 2014 - link
Why does every single performance consistency graph say 4KB random write QD 32?markoshark - Sunday, April 27, 2014 - link
I'm wondering if any testing is done with a 30/70 read/write ratio - Most i've seen is 70% read.With enterprise drives, they are often rebadged and used in SANs - Would be interesting to see how they compare in write-intensive enviroments (VDI)