Intel SSD DC S3500 Review (480GB): Part 1
by Anand Lal Shimpi on June 11, 2013 6:10 PM EST- Posted in
- Storage
- IT Computing
- SSDs
- Intel
- Datacenter
- Enterprise
Performance Consistency
In our Intel SSD DC S3700 review I introduced a new method of characterizing performance: looking at the latency of individual operations over time. The S3700 promised a level of performance consistency that was unmatched in the industry, and as a result needed some additional testing to show that. The reason we don't have consistent IO latency with SSDs is because inevitably all controllers have to do some amount of defragmentation or garbage collection in order to continue operating at high speeds. When and how an SSD decides to run its defrag and cleanup routines directly impacts the user experience. Frequent (borderline aggressive) cleanup generally results in more stable performance, while delaying that can result in higher peak performance at the expense of much lower worst case performance. The graphs below tell us a lot about the architecture of these SSDs and how they handle internal defragmentation.
To generate the data below I took a freshly secure erased SSD and filled it with sequential data. This ensures that all user accessible LBAs have data associated with them. Next I kicked off a 4KB random write workload across all LBAs at a queue depth of 32 using incompressible data. I ran the test for just over half an hour, no where near what we run our steady state tests for but enough to give me a good look at drive behavior once all spare area filled up.
I recorded instantaneous IOPS every second for the duration of the test. I then plotted IOPS vs. time and generated the scatter plots below. Each set of graphs features the same scale. The first two sets use a log scale for easy comparison, while the last set of graphs uses a linear scale that tops out at 50K IOPS for better visualization of differences between drives.
The high level testing methodology remains unchanged from our S3700 review. Unlike in previous reviews however, I did vary the percentage of the drive that I filled/tested depending on the amount of spare area I was trying to simulate. The buttons are labeled with the advertised user capacity had the SSD vendor decided to use that specific amount of spare area. If you want to replicate this on your own all you need to do is create a partition smaller than the total capacity of the drive and leave the remaining space unused to simulate a larger amount of spare area. The partitioning step isn't absolutely necessary in every case but it's an easy way to make sure you never exceed your allocated spare area. It's a good idea to do this from the start (e.g. secure erase, partition, then install Windows), but if you are working backwards you can always create the spare area partition, format it to TRIM it, then delete the partition. Finally, this method of creating spare area works on the drives we've tested here but not all controllers may behave the same way.
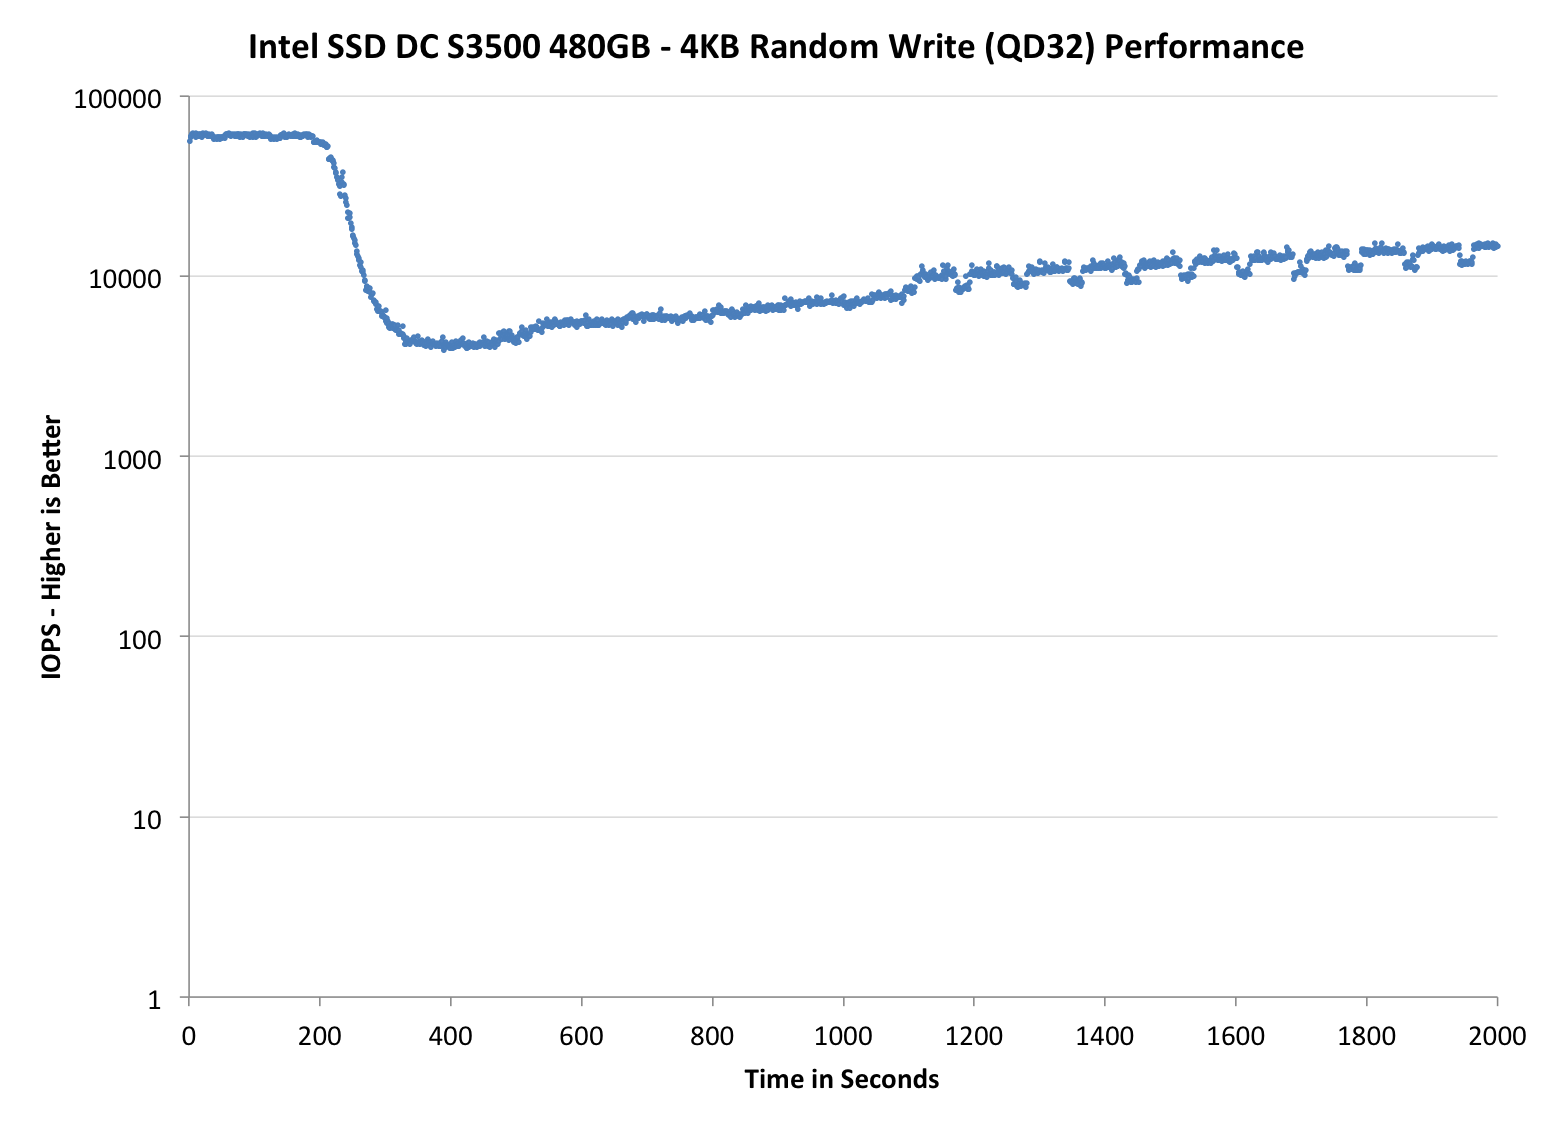
The first set of graphs shows the performance data over the entire 2000 second test period. In these charts you'll notice an early period of very high performance followed by a sharp dropoff. What you're seeing in that case is the drive allocating new blocks from its spare area, then eventually using up all free blocks and having to perform a read-modify-write for all subsequent writes (write amplification goes up, performance goes down).
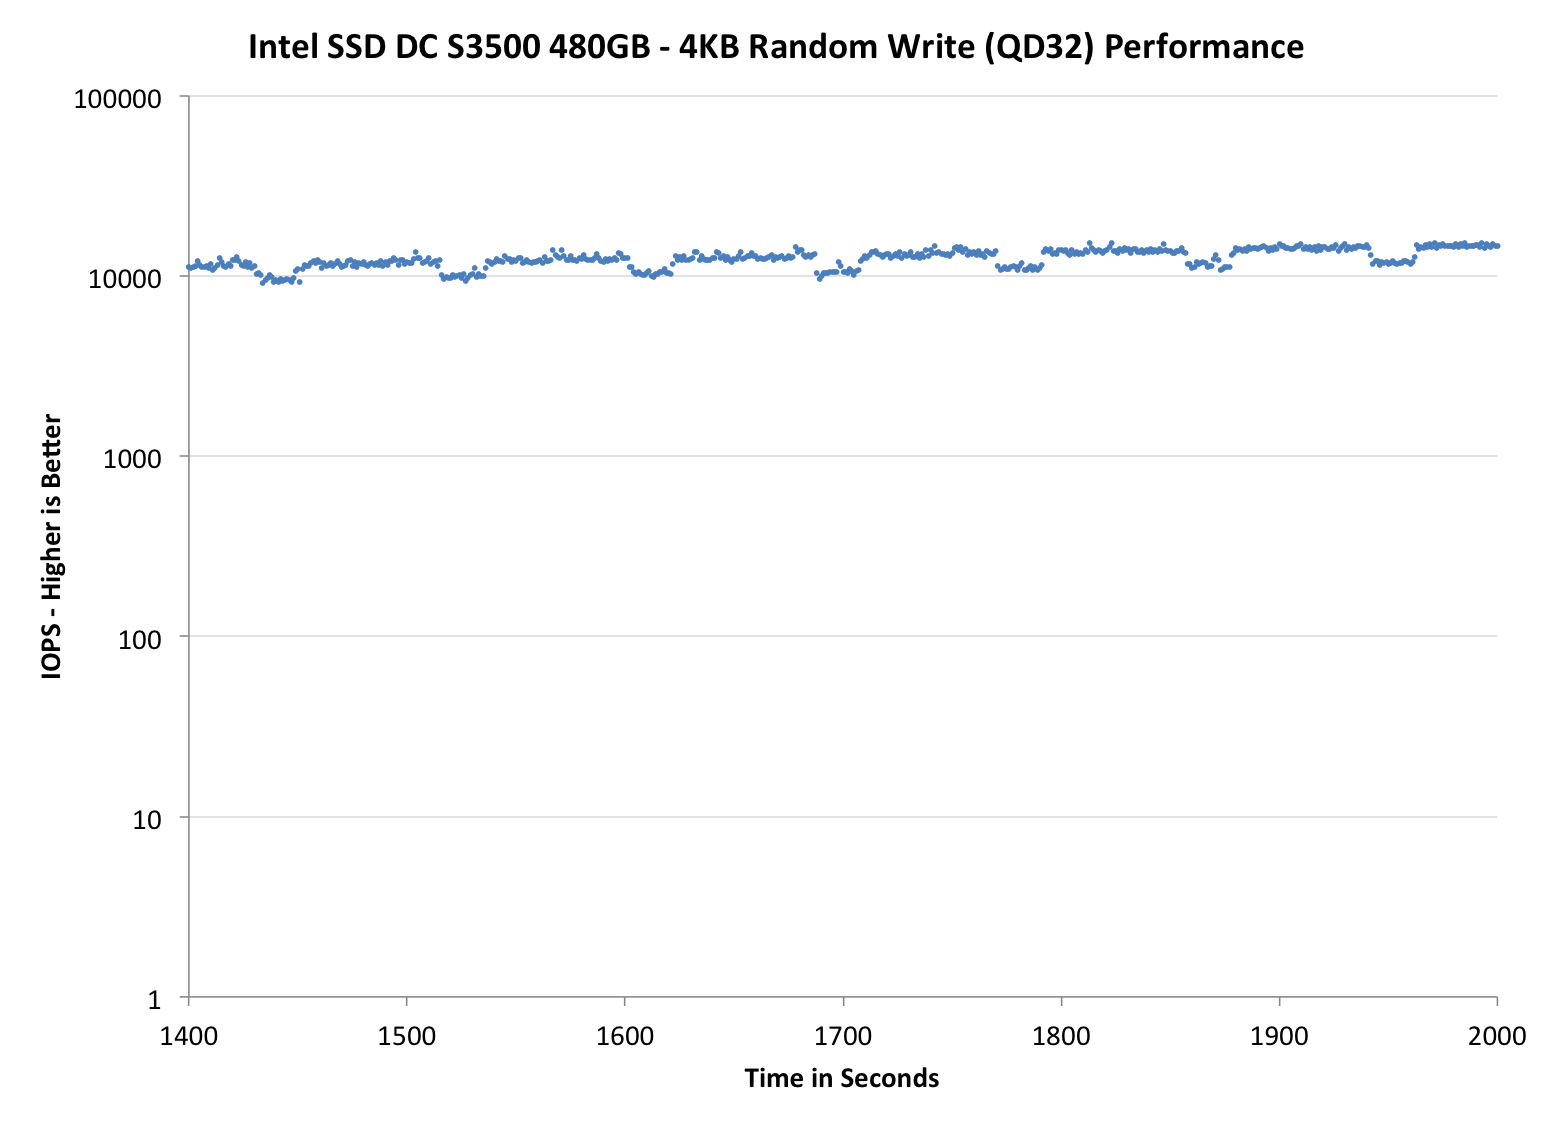
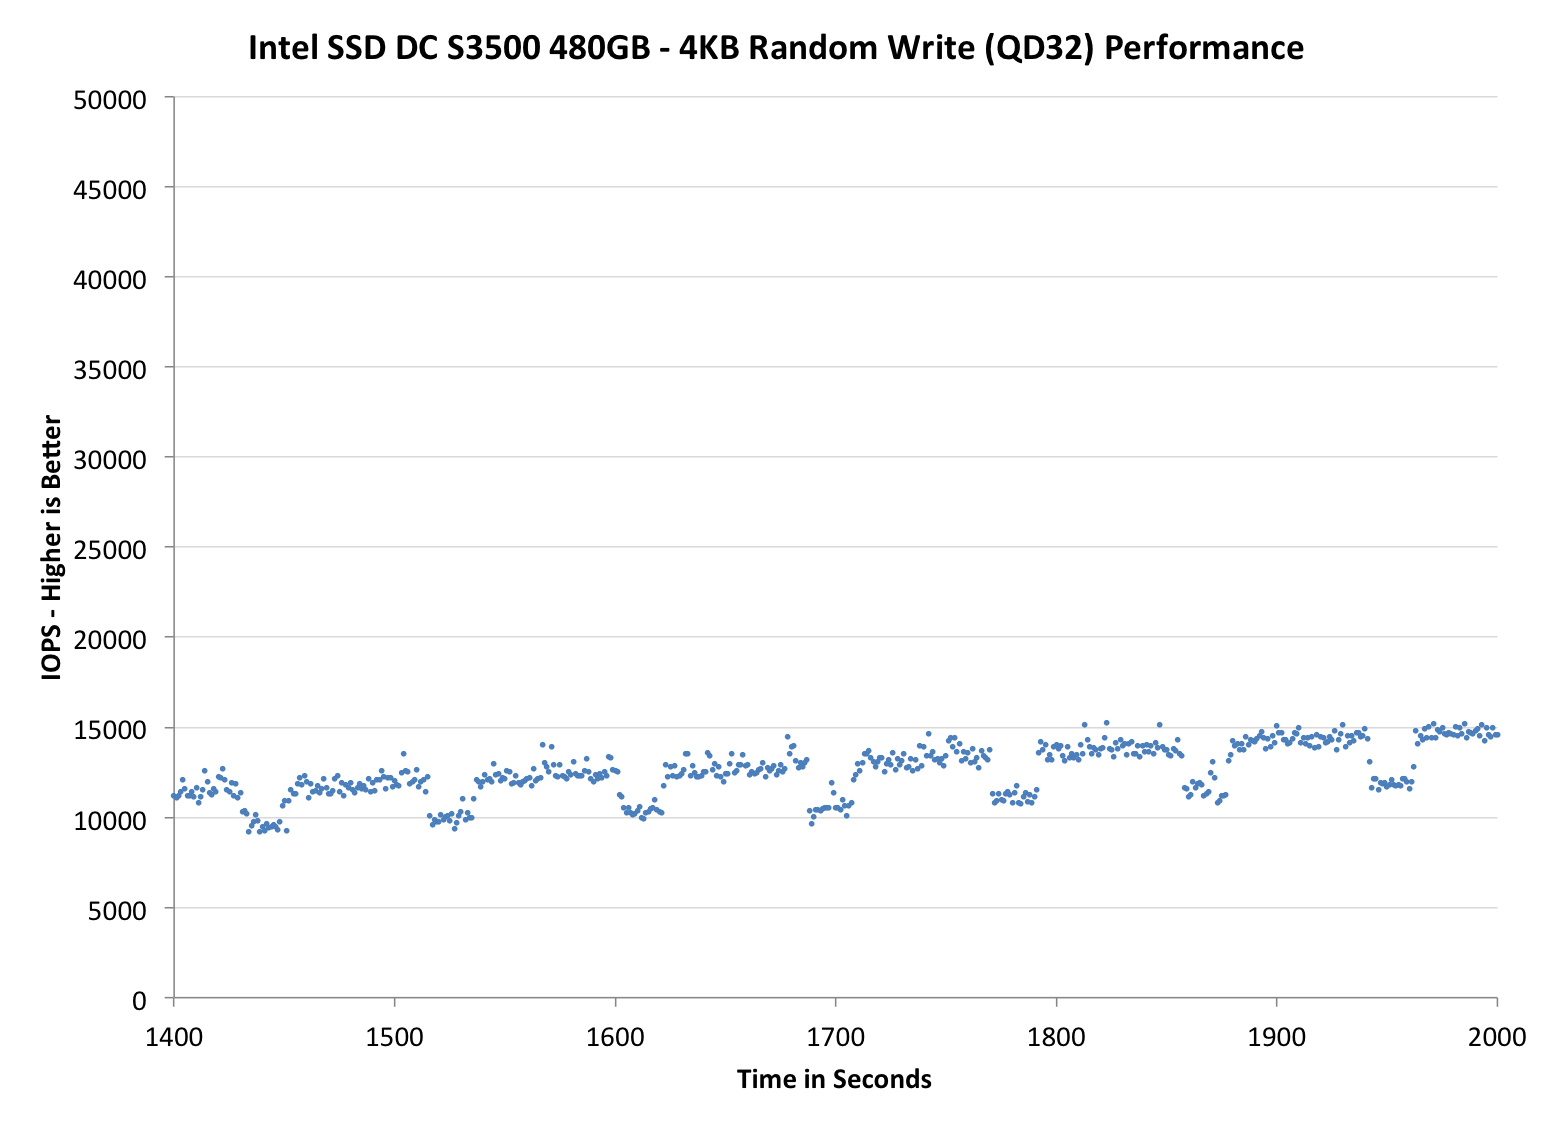
The second set of graphs zooms in to the beginning of steady state operation for the drive (t=1400s). The third set also looks at the beginning of steady state operation but on a linear performance scale. Click the buttons below each graph to switch source data.
 |
|||||||||
| Intel SSD DC S3500 480GB | Intel SSD DC S3700 200GB | Seagate 600 Pro 400GB | |||||||
| Default | |||||||||
While it's not quite as pretty of a curve as what we saw with the S3700, the two drives are clearly related. Intel's SSD DC S3500 delivers incredibly predictable performance. The biggest take away is that Intel is able to still deliver good performance consistency even with much less NAND spare area than on the S3700. Architecture enables what we see here, not just spare area.
 |
|||||||||
| Intel SSD DC S3500 480GB | Intel SSD DC S3700 200GB | Seagate 600 Pro 400GB | |||||||
| Default | |||||||||
Remember this predictable little pattern? The periodic dips in performance are Intel's defrag/GC routines operating at regular (and frequent) intervals. You'll also notice the slight upward trend here; the S3500 is looking to improve its performance over time, even under heavy load, without sacrificing consistency.
 |
|||||||||
| Intel SSD DC S3500 480GB | Intel SSD DC S3700 200GB | Seagate 600 Pro 400GB | |||||||
| Default | |||||||||
This zoomed in view really gives us great perspective as to what's going on. I included comparable data from other drives in the S3700 review, but the size/scales of those charts made inclusion here not possible in short form.


54 Comments
View All Comments
ShieTar - Wednesday, June 12, 2013 - link
I think the metric is supposed to show that you need a dedicated drive per VM with mechanical HDDs, but that one of these SSDs can support and not slow down 12 VMs by itself. Having 12 VMs access the same physical HDD can drive access times into not-funny territory.The 20GB per VM can be enough if have a specific kernel and very little software. Think about a "dedicated" Web-Server. Granted, the comparison assumes a quiet specific usage scenario, but knowing Intel they probably did go out and retrieve that scenario from an actual commercial user. So it is a valid comparison for somebody, if maybe not the most convincing one to a broad audience.
Death666Angel - Wednesday, June 12, 2013 - link
Read the conclusion page. That just refers to the fact that those 2 setups have the same random IO performance. Nothing more, nothing less.FunBunny2 - Wednesday, June 12, 2013 - link
Well, there's that other vector to consider: if you're enamoured of sequential VSAM type applications, then you'd need all that HDD footprint. OTOH, if you're into 3NF RDBMS, you'd need substantially less. So, SSD reduces footprint and speeds up the access you do. Kind of a win-win.jimhsu - Wednesday, June 12, 2013 - link
Firstly, the 500 SAS drives are almost certainly short-stroked (otherwise, how do you sustain 200 IOPS, even on 15K drives). That cuts capacity by 2x at least. Secondly, the large majority of web service/database/enterprise apps are IO-limited, not storage-limited, hence all that TB is basically worthless if you can't get data in and out fast enough. For certain applications though (I'm thinking image/video storage for one), obviously you'd use a HDD array. But their comparison metric is valid.rs2 - Wednesday, June 12, 2013 - link
That doesn't mean it's not also confusing. The primary purpose of a "SW SAN Solution" is storage, not IOPS, so one SAN is not comparable to another SAN unless they both offer the same storage capacity.In the specific use-case of virtualization, IOPS are generally more important than storage space. But if IOPS are what they want to compare across solutions is IOPS performance then they shouldn't label either column a "SAN".
So yes, on the one hand it's valid, but on the other it's definitely presented in a confusing way.
thomas-hrb - Wednesday, June 12, 2013 - link
It is a typical example of a vendor highlighting the statistics they want to you remember, and ignoring the ones that they hope are not important. That is the reason why technical people exist. Any fool can read and present excellent arguments for one side or the other. It is the understanding of these parameters, what they actually mean in a real world usage scenario that is the bread and butter of our industry. I don't know if this is typical for most modern SAN's. I am using a IBM v7000 (very popular SAN for IBM). But the v7000 comes with Auto Teiring which moves "hot blocks" from normal HDD Storage to SSD, thus having a solid performing random IO SSD that is consistent is essential to how this type of SAN works.Jaybus - Monday, June 17, 2013 - link
Well, but but look at it another way. You can put 120 SSDs in 20U and have 200 GB per VM using half the rack space and a tenth the power but with FAR higher performance, and for less cost.Also, the ongoing cost of power and rack space is more important. In the same 42U space you can have a 252 SSD SAN (201,600 GB) and still use less than a fifth the power and have far, far greater performance.
thomas-hrb - Wednesday, June 12, 2013 - link
They are comparing IOP's. There are a few use cases where having large amounts of storage is the main target (databases, mailbos datastores etc), but typically application servers are less than 20GB in size. Even web-servers will typically be less than 10GB (nix based) in size. Ultimately any storage system will have a blend of both technologies and have a teir'd setup where they have Traditional HDD's to cover their capacity and somewhere between 5-7% of that capacity as high performance SSD's to cover for the small subset of data blocks that are "hot" and require significant'y more IOP's. This new SSD simply gives storage professionals an added level of flexibility in their designs.androticus - Wednesday, June 12, 2013 - link
Why is "performance consistency" supposed to be so good... when the *lowest* performance number of the Seagate 600 is about the same as the *consistent* number for Intel? The *average* of the Seagate looks much higher? I could see this as an advantage if the competitor numbers also went way below Intel's consistent number, but not in this case.Lepton87 - Wednesday, June 12, 2013 - link
Compared to Seagate random write performance this doesn't look unlike a GF that delivers almost constant 60fps compared to a card that delivers 60-500fps, so what's the big deal? Cap the performance at whatever level Intel SSD delivers and you will have the same consistency, but what's the point? It only matters if the drives deliver comparable performance but one is a roller-coaster and the second is very consistent which is not the case is this comparison. Allocate more spare area to the Seagate, even 25% and it will mop the floor with this drive and price per GB will be still FAR lower. Very unimpressed with this drive, but because it's an Intel product we are talking about on Anandtech it's lauded and praised like there's no tomorrow.