The ASRock DeskMini A300 Review: An Affordable DIY AMD Ryzen mini-PC
by Ganesh T S on April 26, 2019 8:00 AM ESTBAPCo SYSmark 2018
The ASRock DeskMini A300 was evaluated using our Fall 2018 test suite for small-form factor PCs. In the first section, we will be looking at SYSmark 2018.
Prior to describing the benchmark itself, we should quickly address concerns about using the benchmark to test AMD-based systems, given that AMD is not a part of the BAPCo consortium. In fact, AMD has been pretty vocal against the benchmark, with their last salvo appearing in 2016. AMD had quit BAPCo in 2011 over concerns of the GPU not being represented enough in the benchmarks.
Having analyzed the SYSmark 2018 white paper, and actually followed the execution of the benchmark workloads, we can say that SYSmark 2018 does represent possible usage patterns for a PC used in a business / office setting. Even if one were to side with AMD on the scoring aspect, the benchmark's rather unique energy consumption metric accurately represents the efficiency of the system for the realistic workloads. Overall, we believe that SYSmark 2018 is a good benchmark for systems used in certain scenarios; though it goes without saying that we never put too much stock in any one benchmark, which is why we only use it as one of out several benchmarks in our mini-PC reviews.
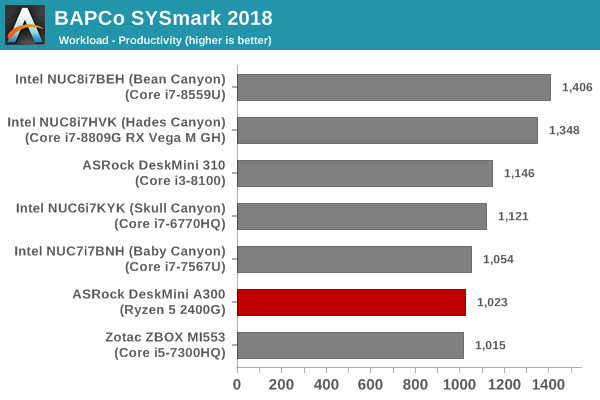
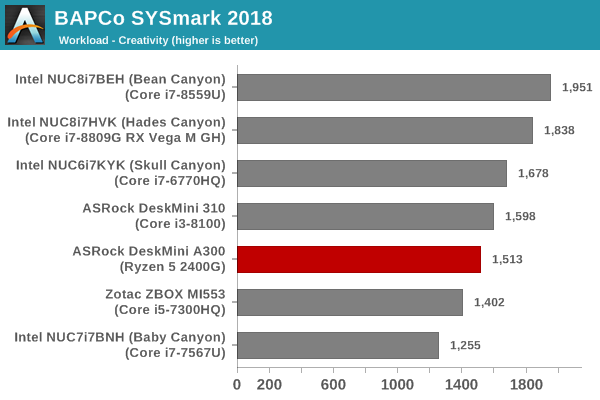
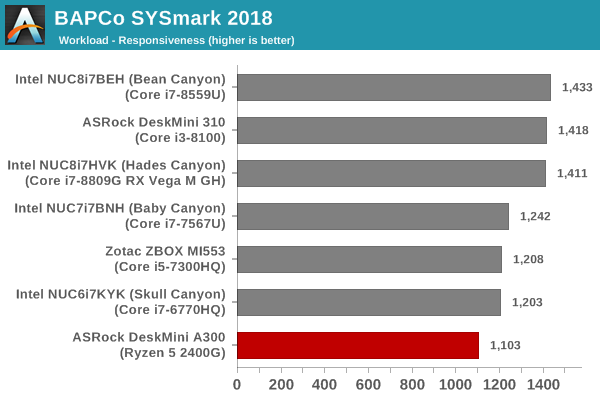
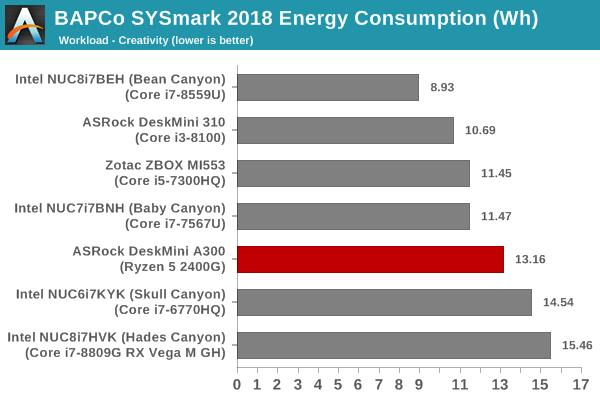
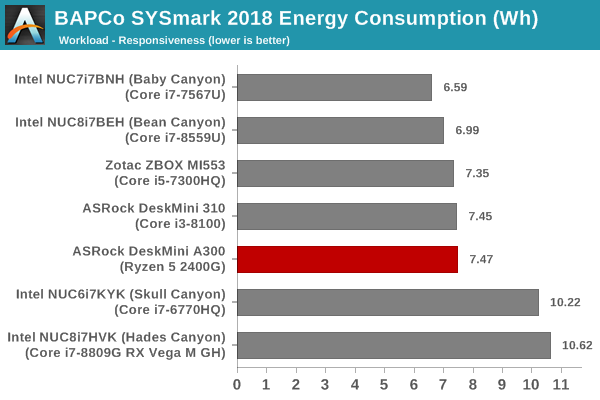
Anyhow, BAPCo's SYSmark 2018 is an application-based benchmark that uses real-world applications to replay usage patterns of business users in the areas of productivity, creativity, and responsiveness. The 'Productivity Scenario' covers office-centric activities including word processing, spreadsheet usage, financial analysis, software development, application installation, file compression, and e-mail management. The 'Creativity Scenario' represents media-centric activities such as digital photo processing, AI and ML for face recognition in photos and videos for the purpose of content creation, etc. The 'Responsiveness Scenario' evaluates the ability of the system to react in a quick manner to user inputs in areas such as application and file launches, web browsing, and multi-tasking.
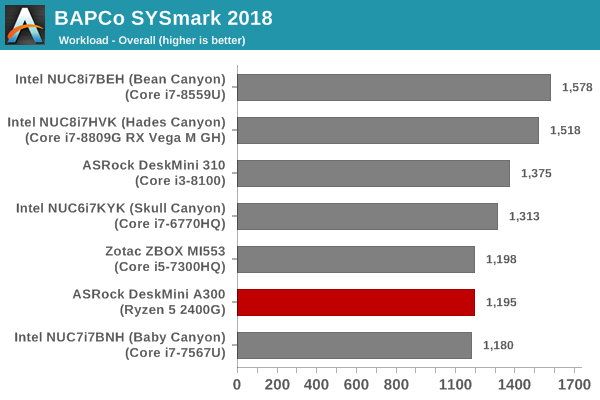
Scores are meant to be compared against a reference desktop (the SYSmark 2018 calibration system, a Dell Optiplex 5050 tower with a Core i3-7100 and 4GB of DDR4-2133 memory to go with a 128GB M.2 SATA III SSD). The calibration system scores 1000 in each of the scenarios. A score of, say, 2000, would imply that the system under test is twice as fast as the reference system.
SYSmark 2018 also adds energy measurement to the mix. A high score in the SYSmark benchmarks might be nice to have, but, potential customers also need to determine the balance between power consumption and the efficiency of the system. For example, in the average office scenario, it might not be worth purchasing a noisy and power-hungry PC just because it ends up with a 2000 score in the SYSmark 2014 SE benchmarks. In order to provide a balanced perspective, SYSmark 2018 also allows vendors and decision makers to track the energy consumption during each workload. In the graphs below, we find the total energy consumed by the PC under test for a single iteration of each SYSmark 2018 workload. For reference, the calibration system consumes 5.36 Wh for productivity, 7.71 Wh for creativity, 5.61 Wh for responsiveness, and 18.68 Wh overall.
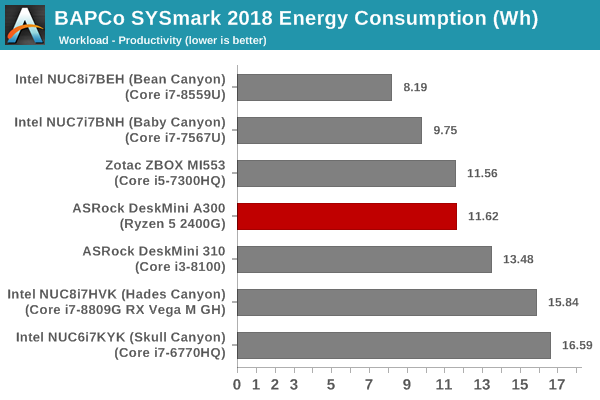
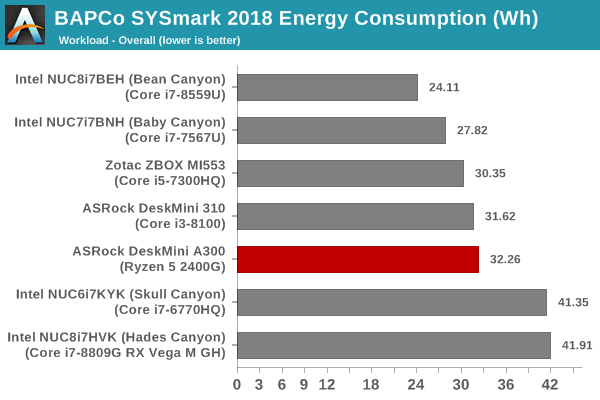
In the rest of the review, our focus will be on comparing the performance of the DeskMini A300 with the Ryzen 5 2400G and the DeskMini 310 with the Core i3-8100. Our builds for the system have approximately the same price point, and they are both contemporary systems. The overall energy consumption for the A300 is only slightly higher than the DeskMini 310, but the benchmark scores are lower. The DeskMini A300 configuration performs as well as the Zotac ZBOX MI553 (with the 45W Core i5-7300HQ) and the Baby Canyon NUC (with the 15W Core i7-7567U). However, those machines consume around 2 to 5 Wh less to achieve those scores.


88 Comments
View All Comments
ganeshts - Friday, April 26, 2019 - link
Actually, it is OK with Kodi (XBMC) and Microsoft Edge / VideoUI app on Windows. It is only VLC and LAV Video Decoder having issues.DigitalFreak - Friday, April 26, 2019 - link
" The hardware itself is actually rather capable (as noted above), but the the current state of the Radeon drivers holds it back."Same old story that's been going on for a decade or more with ATI/AMD.
Irata - Friday, April 26, 2019 - link
Some more power consumption numbers: (A300 vs. A310)Idle power: 81%
Max power consumption (stressing CPU+GPU): 131%.
But this gives us:
- Gaming performance: no numbers for the A310, however the A300 has an average gaming performance of 204 % vs. Bean Canyon (using the fps shown as default) at 126 of its power consumption, so again it is more power efficient.
Cinebench Muti-threaded rendering: 137% of he A310's performance @ (using the max power consumption as a guideline) 131% of the power consumption.
Note: It would be nice to show the power consumption for all benchmarks, i.e. gaming, 7-zip, cinebench....
Mil0 - Sunday, April 28, 2019 - link
I was thinking along this lines, thanks for doing the math. It seems the A300 is basically always more power efficient.Especially given that machines like this will spend a lot of time at or near idle. If the light load scenario comes close to the 81% power usage, in the long run this could save quite a bit of power.
niva - Monday, April 29, 2019 - link
So you guys are reaching a different conclusion than what the article stated in terms of efficiency?In the conclusions paragraph it stated that this machine is "not particularly energy efficent."
I also glanced at the numbers initially and was confused as to how they reached that conclusion but didn't do math. Why did the author use that language?
mikato - Tuesday, April 30, 2019 - link
The language you refer to is the author comparing it to the Intel Mini-PC competitors, and not just the other ASRock DeskMini. Commenters Irata and Mil0 above were comparing DeskMini A300 vs DeskMini A310.Irata - Wednesday, May 1, 2019 - link
That is correct, although in the case of gaming results, I had to compare it to another system since there was no data for the A310.The thought was, how does the performance delta align with the power consumption delta. Now it seems that Ganesh disagrees as I am using linear values but imho this approach seems valid to me as well.
So if it has 10% less performance but uses 10% less power, at least for me the energy efficieny is identical. Same if it has 10% more performance but uses 10% more power.
plonk420 - Saturday, May 4, 2019 - link
never had an issue with drivers on AMD except for an edge case: trying to install newer ones on Windows Server 2008 R2 Enterprise.sadly this might be an issue with the disconnect between OEM and AMD's drivers
Irata - Friday, April 26, 2019 - link
I found this a bit odd:"For traditional office and business workloads, it gets the job done; and while it's not particularly energy efficient, the upfront cost itself is lower".
Looking at the Bapco Sysmark overall power consumption numbers, the DeskMini A300 and 310 have basically identical numbers (32.26 vs. 31.62 Wh). Seeing the the performance delta is not considerable I find this statement a bit odd. And these are Bapco Sysmark numbers which need to be taken with a rock of salt.
davie887 - Friday, April 26, 2019 - link
Intel CAN'T be shown in anything other that their best light.Anyone who questions them has to prepare for the consequences :D