Maxon Releases Cinebench R20 Benchmark
by Ian Cutress on March 5, 2019 2:38 PM EST- Posted in
- CPUs
- Benchmarks
- CineBench
One of the key benchmarks that have been used in the industry is Cinebench. The latest version has been Cinebench R15, released for version 15 of Cinema 4D. In recent years it has slowly become less relevant, as Maxon has moved through to version 19 and 20 of the software. To match the latest version of the software, the company has now launched the Cinebench R20 benchmark.
The benchmark is already available from the Maxon website, working through the Windows Store or the Apple App Store on Macs. It does not look like there is a separate standalone download.
The new benchmark implements a number of new features available for x86 processors. This includes newer AVX instructions, implemented through Intel's Embree raytracing technology, applicable on both AMD and Intel processors. The new benchmark focuses purely on CPU performance, and solves one of the issues with the R15 version - it now scales beyond 64 threads better by having a larger scene. There will be a minimum performance limit to run the new benchmark, which is listed as a memory limit.
Similar to R15, there is a single threaded test and a multithreaded test. The GPU test has been dropped (it hasn't been relevant for a long time).
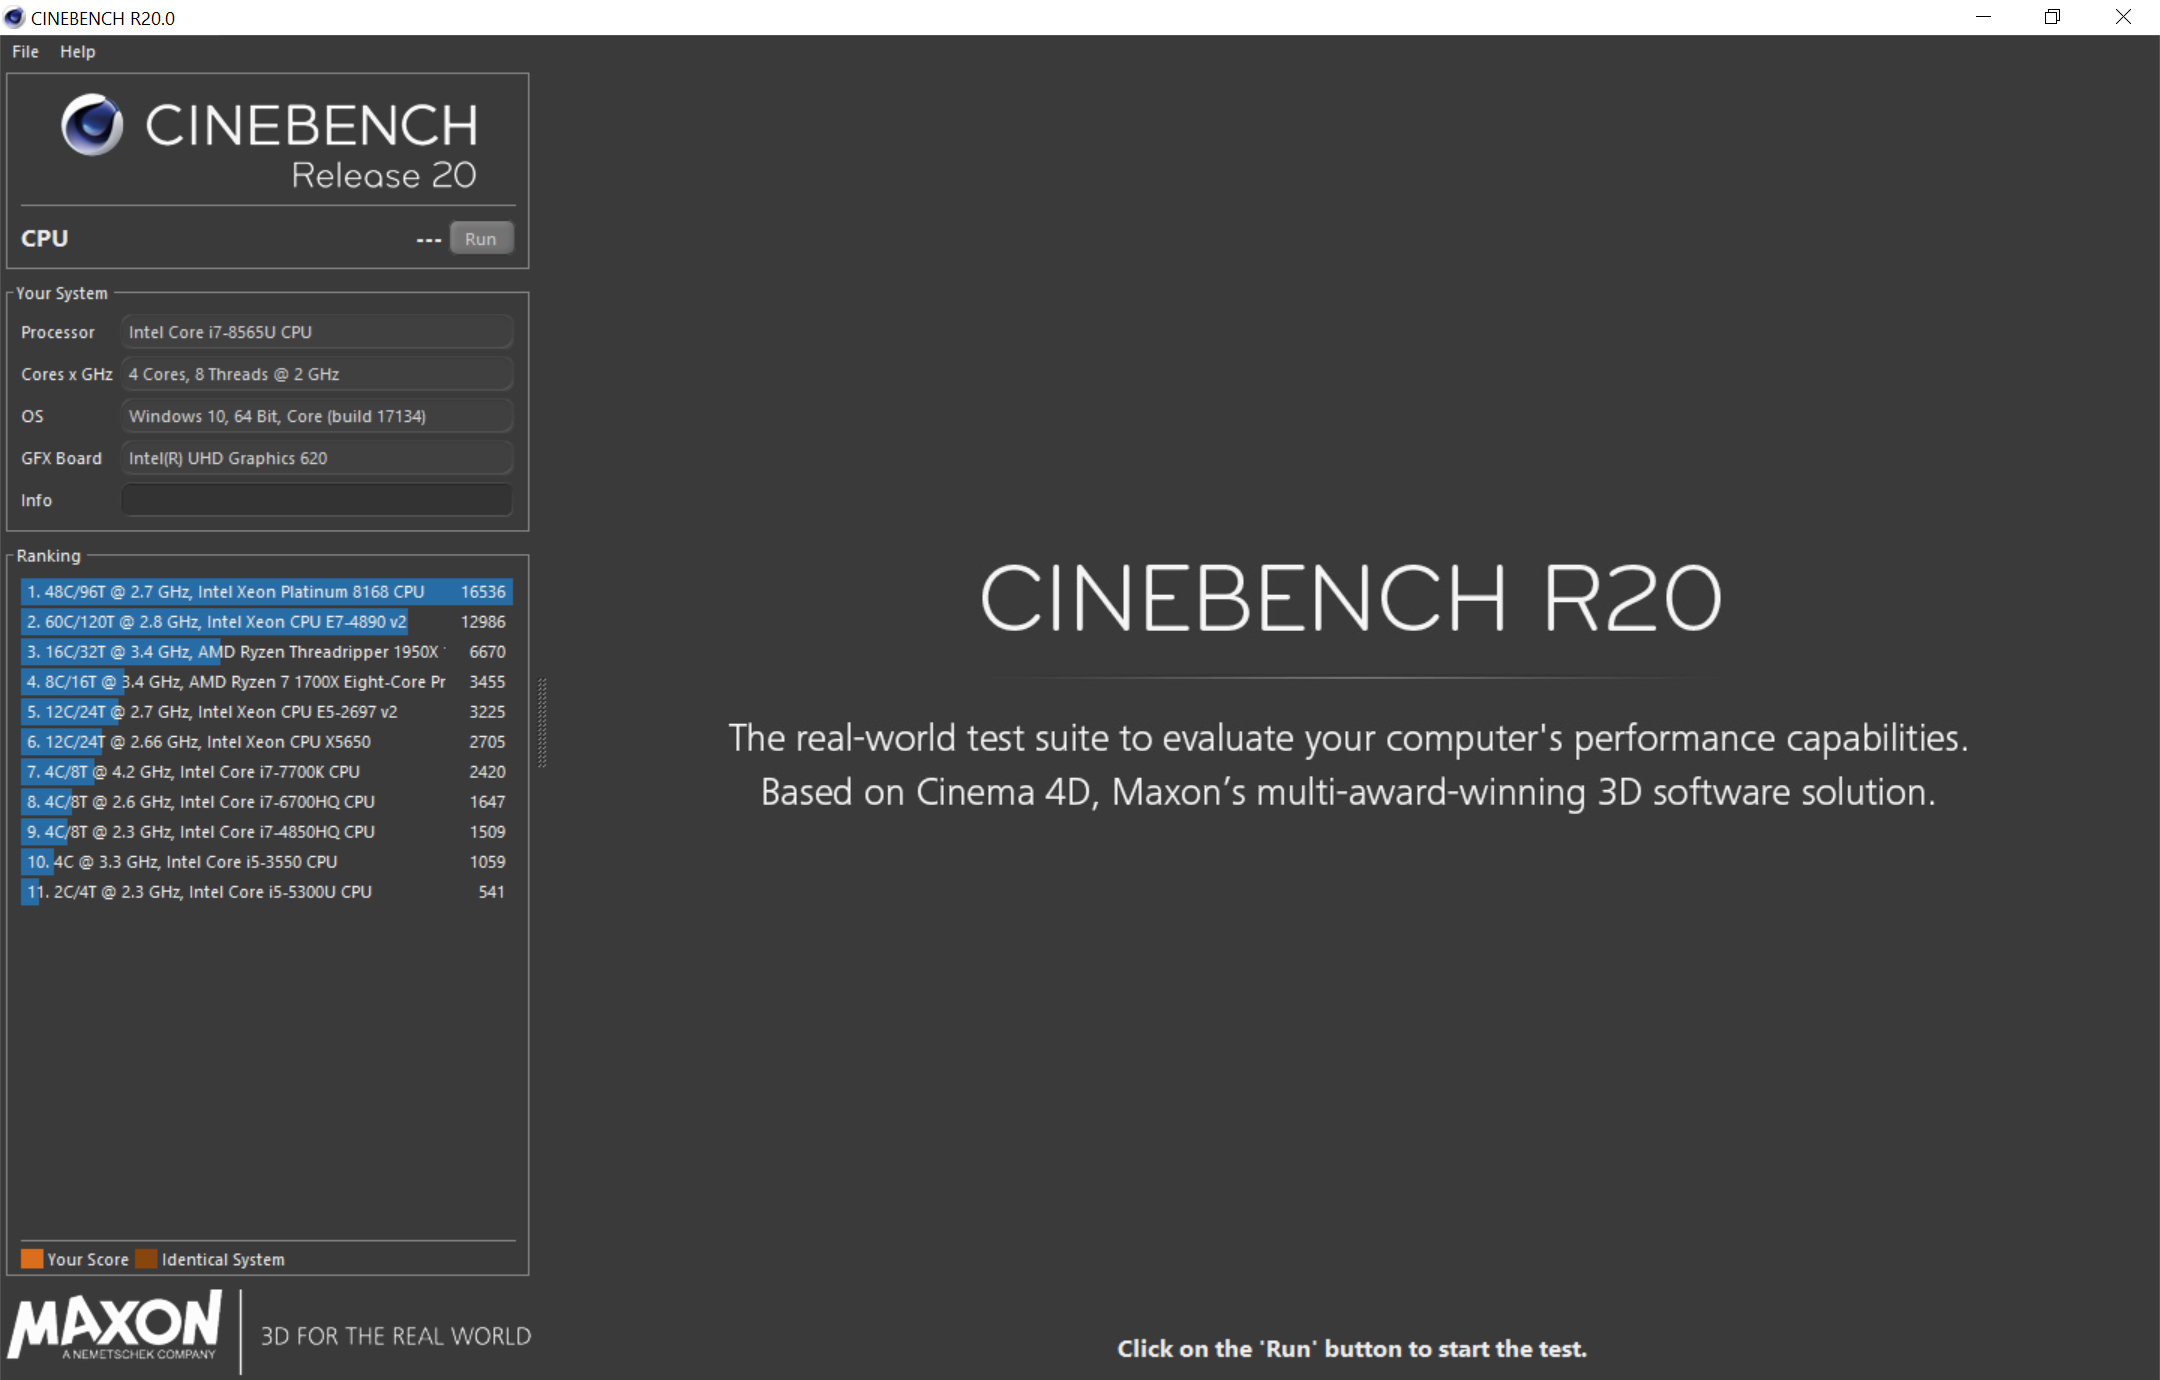
For performance, the following results are provided as standard in the benchmark download:
- 2x Xeon Platinum 8168, 48C/96T: 16436 points
- 4x Xeon E7-4890 v2, 60C/120T: 12986 points
- Ryzen Threadripper 1950X, 16C/32T: 6670 points
- Ryzen 7 1700X, 8C/16T: 3455 points
- Xeon E5-2697 v2, 12C/24T: 3225 points
- 2x Xeon X5650, 12C/24T: 2705 points
- Core i7-7700K, 4C/8T: 2420 points
- Core i7-6700HQ, 4C/8T: 1647 points
- Core i7-4850HQ, 4C/8T: 1509 points
- Core i5-3550, 4C/4T: 1059 points
- Core i5-5300U, 2C/4T: 514 points
With my Whiskey Lake Core i7-8565U that I'm writing this news post on, I scored 1245 points.
For the single core benchmark, the numbers are:
- Intel i7-7700K: 476 points
- AMD 1950X: 400 points
- Platinum 8168: 379 points
- AMD 1700X: 378 points
- Intel i7-6700HQ: 359 points
- Intel i7-4850HQ: 298 points
- Intel i5-3550: 283 points
- Intel i5-5300U: 280 points
- Xeon E5-2697 v2: 255 points
- Xeon E7-4890 v2: 197 points
- Xeon X5650: 191 points
The link to Maxon's page is as follows:
https://www.maxon.net/en/products/cinebench-r20-overview/
We will be looking to see if we can roll this benchmark out across our CPU suite.

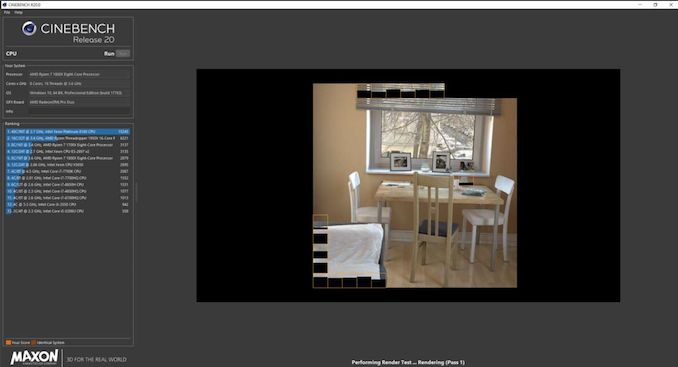
The scene being rendered


57 Comments
View All Comments
abufrejoval - Saturday, March 9, 2019 - link
I run Windows 2019 server, basically the same as Windows 10 1809, except that it doesn't support the Windows store and thus I cannot download the benchmark.Now I actually consider that a feature, because I cannot think of any benefit the Microsoft store would have to consumers. But it seems Microsoft would rather like to force the planet now to pay a Microsoft tax on all software that runs on their OS or just uses some of their APIs (WINE beware).
Considering that Microsoft has been properly punished for including their media players and browsers into an operating system, this approach seems a major violation of market power which deserves full anti-trust attention and swift fines at a level impossible not to learn from..
Server 2019 is also missing most of the snooping features of desktop windows variants, perhaps the ony Microsoft OS actually capable to operate under GDPR compliance. Another area where privacy authorities should urgently exert serious authority and steer Microsoft away from behavior that should cost it dearly to pursue.
abufrejoval - Saturday, March 9, 2019 - link
5196 on E5-2696v3 after I found out how to sideload it without a store, CPU never pushing beyond 58°C and 98 Watts according to HWinfo 6.02, 2.6GHz on all 18 cores and 36 threads.Cinebench R15 on this CPU is 2552.
wbj - Thursday, March 28, 2019 - link
Direct download, here you go: https://www.maxon.net/en-us/support/downloads/zircosil - Saturday, March 9, 2019 - link
i5-4670K running @ 4.4GHz1559 points multi-threaded
407 points single core
maoparmannz - Tuesday, April 2, 2019 - link
i just got 289 with my shit old hp laptop amd a4-6210apu with r3 graphics 4 cores @1.8 ghz and 8 gb ram . i looking at building a pc plus i am getting a old i5 2400 to play with i just wanted to see how slow this was as a base and will see what these other pc will do when i canMAX_AB - Saturday, April 6, 2019 - link
Cinebench R20 Score 15,836 best Cinebench R15 is 6872System: Dual Xeon Supernmicro Workstation
CPU 2x Xeon Platinum 8168 es2 (QLKN), no OC.
Base 2.4GHz/Allcore 2.9GHz/Turbo 3.5GHz (0.3GHz lower than production 8168)
MBD Supermicro X11DPG-QT
GPU GTX 1080Ti
RAM 128GB Samsung DDR4 2400 C17 ECC
SSD WDC SN750 512GB NVME
PSU EVGA 1300G2
PDU Sceptre U27 UHD IPS 27"
Case Rosewill B2
Cooling- standard air, 2x Supermicro SNK00070APS
Settings: NUMA on, Onboard VGA on, EFI mode, default CPU settings
Gurthang77 - Thursday, July 18, 2019 - link
Intel i7 4790K (4 GHz) -- 1891