Intel NUC6CAYH (Arches Canyon) Apollo Lake UCFF PC Review
by Ganesh T S on January 12, 2018 8:00 AM EST- Posted in
- Systems
- Intel
- NUC
- UCFF
- Apollo Lake
- Arches Canyon
Performance Metrics - I
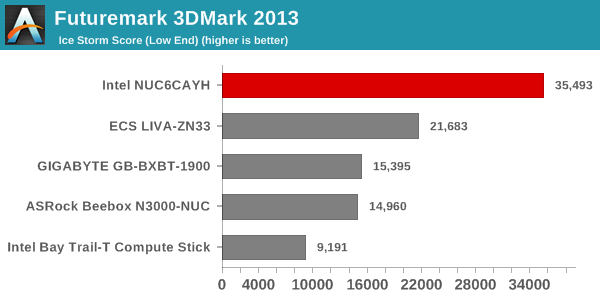
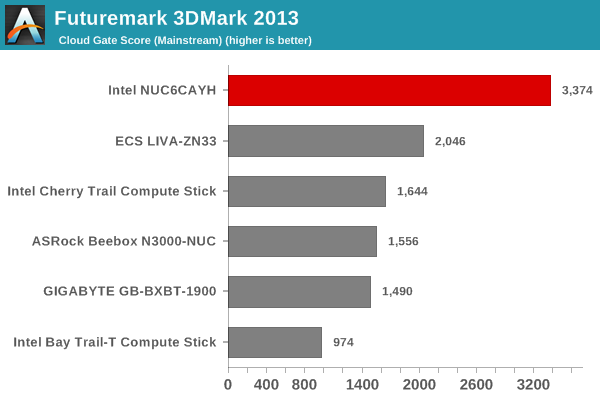
The Intel NUC6CAYH was evaluated using our standard test suite for low power desktops / industrial PCs. Not all benchmarks were processed on all the machines due to updates in our testing procedures. Therefore, the list of PCs in each graph might not be the same. In the first section, we will be looking at SYSmark 2014 SE, as well as some of the Futuremark benchmarks.
BAPCo SYSmark 2014 SE
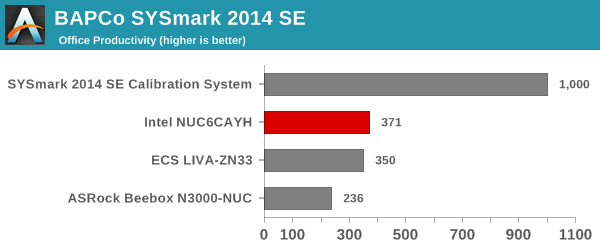
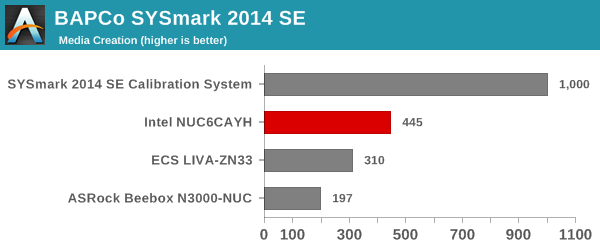
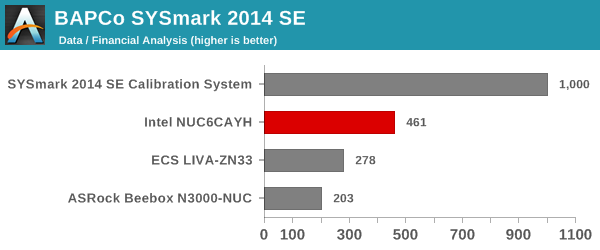
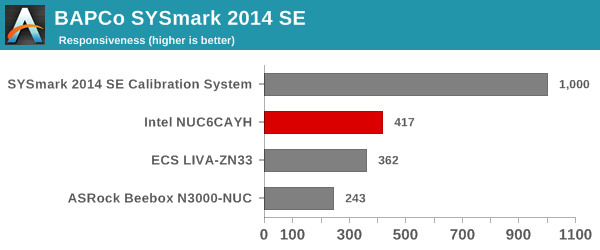
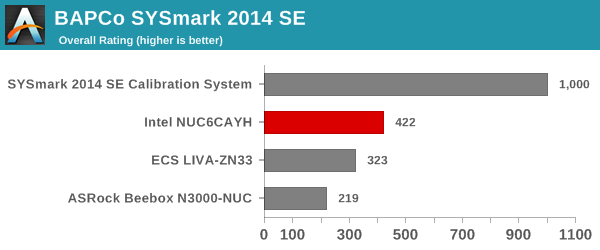
BAPCo's SYSmark 2014 SE is an application-based benchmark that uses real-world applications to replay usage patterns of business users in the areas of office productivity, media creation and data/financial analysis. In addition, it also addresses the responsiveness aspect which deals with user experience as related to application and file launches, multi-tasking etc. Scores are meant to be compared against a reference desktop (the SYSmark 2014 SE calibration system in the graphs below). While the SYSmark 2014 benchmark used a Haswell-based desktop configuration, the SYSmark 2014 SE makes the move to a Lenovo ThinkCenter M800 (Intel Core i3-6100, 4GB RAM and a 256GB SATA SSD). The calibration system scores 1000 in each of the scenarios. A score of, say, 2000, would imply that the system under test is twice as fast as the reference system.
The graphs below shows that the two extra cores and slightly higher speeds in the Celeron J3455 give the NUC6CAYH a distinct boost over the Celeron N3350 in the ECS LIVA-ZN33.
SYSmark 2014 SE also adds energy measurement to the mix. A high score in the SYSmark benchmarks might be nice to have, but, potential customers also need to determine the balance between power consumption and the efficiency of the system. For example, in the average office scenario, it might not be worth purchasing a noisy and power-hungry PC just because it ends up with a 2000 score in the SYSmark 2014 SE benchmarks. In order to provide a balanced perspective, SYSmark 2014 SE also allows vendors and decision makers to track the energy consumption during each workload. In the graphs below, we find the total energy consumed by the PC under test for a single iteration of each SYSmark 2014 SE workload and how it compares against the calibration systems.
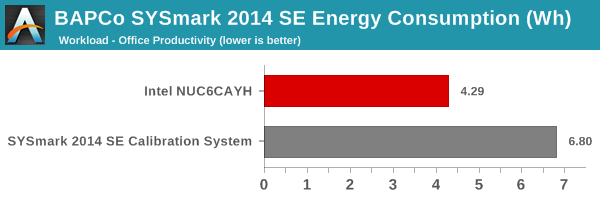
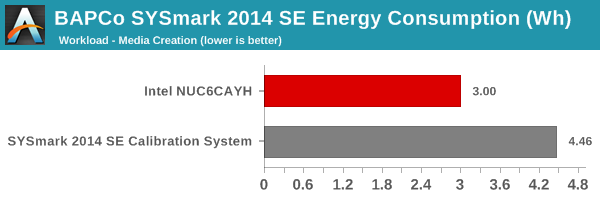

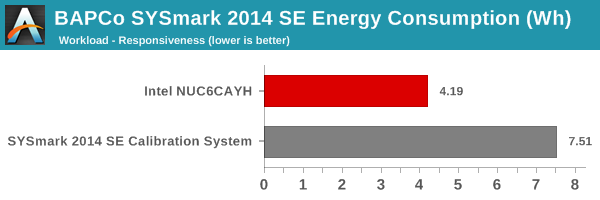
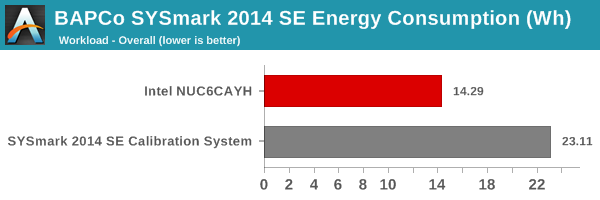
The energy numbers are no big surprise, with the calibration system utilizing a proper desktop CPU compared to the nettop variant used in the NUC6CAYH.
Futuremark PCMark 10
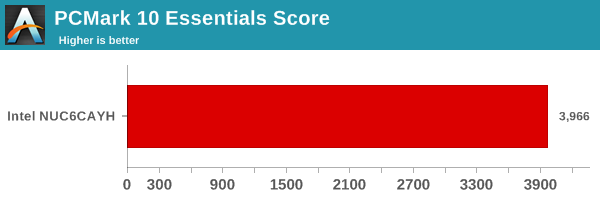
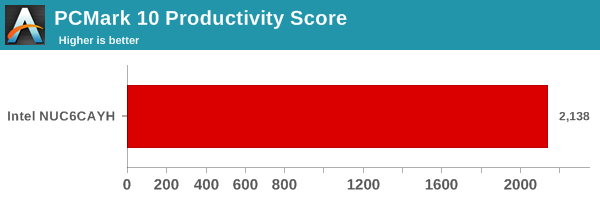
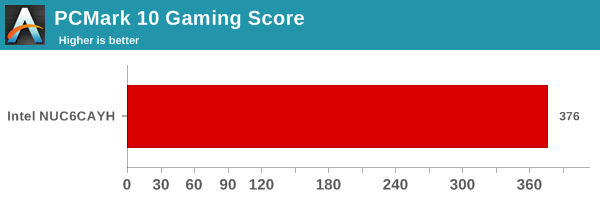
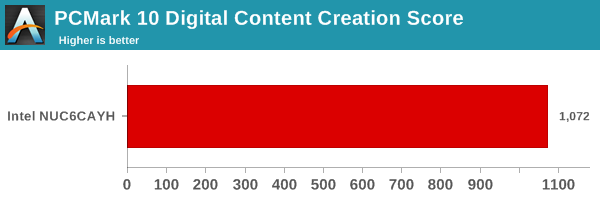
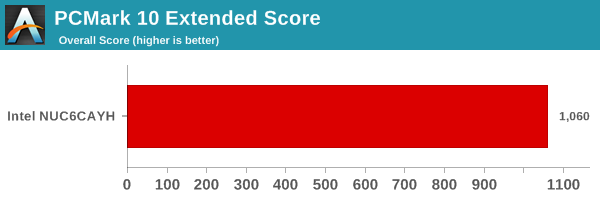
UL's PCMark 10 evaluates computing systems for various usage scenarios (generic / essential tasks such as web browsing and starting up applications, productivity tasks such as editing spreadsheets and documents, gaming, and digital content creation). We benchmarked select PCs with the PCMark 10 Extended profile and recorded the scores for various scenarios. These scores are heavily influenced by the CPU and GPU in the system, though the RAM and storage device also play a part. The power plan was set to Balanced for all the PCs while processing the PCMark 10 benchmark. We do not have PCMark 10 scores of any other Atom-class PC to compare against yet.
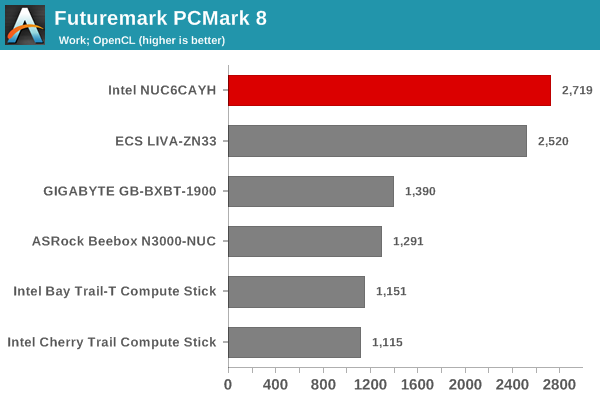
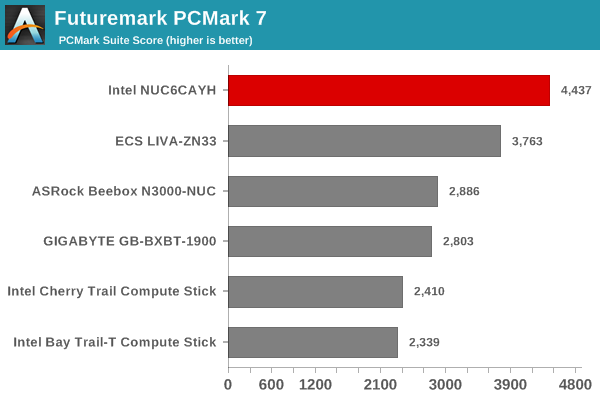
Futuremark PCMark 8
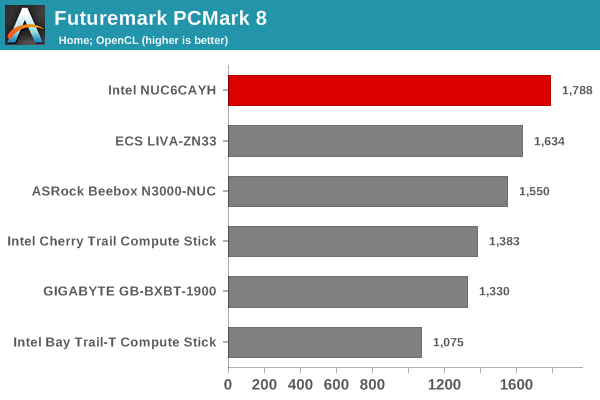
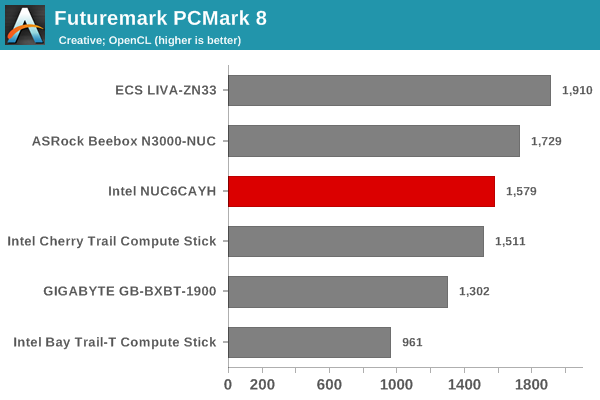
We continue to present PCMark 8 benchmark results (as those have more comparison points) while our PCMark 10 scores database for systems grows in size. PCMark 8 provides various usage scenarios (home, creative and work) and offers ways to benchmark both baseline (CPU-only) as well as OpenCL accelerated (CPU + GPU) performance. We benchmarked select PCs for the OpenCL accelerated performance in all three usage scenarios. These scores are heavily influenced by the CPU in the system. As expected, the Celeron J3455 ends up on top in almost all the benchmarks.
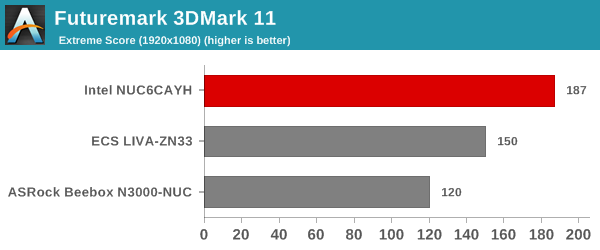
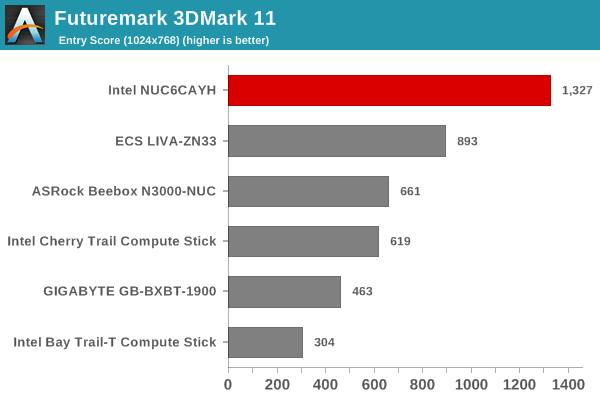
Miscellaneous Futuremark Benchmarks
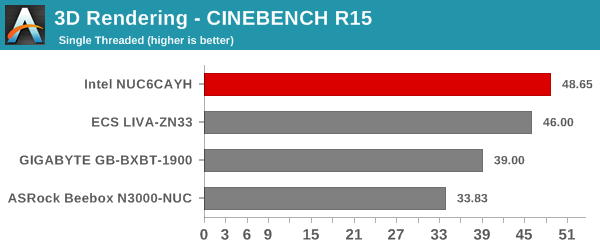
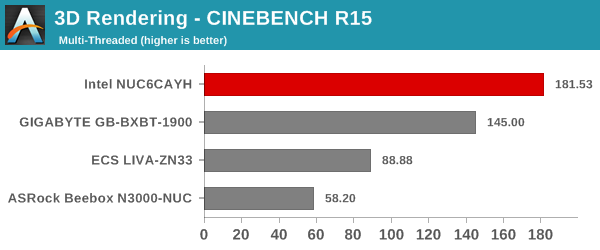
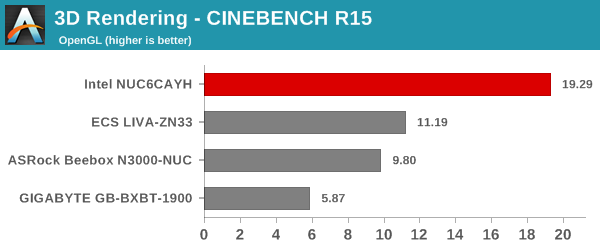
3D Rendering - CINEBENCH R15
We have moved on from R11.5 to R15 for 3D rendering evaluation. CINEBENCH R15 provides three benchmark modes - OpenGL, single threaded and multi-threaded. Evaluation of select PCs in all three modes provided us the following results. The results confirm what we found in the previous section.


54 Comments
View All Comments
Badelhas - Monday, January 15, 2018 - link
Such a coincidence, I bought the NUC6CAYS two days ago, to use it has a HTPC, but I´ve been having multiple issues. One of the reasons I bought this was because it has a SPDIF Toslink Optical port, so I though I could connect it to my Home Cinema and have 5.1 digital sound but that dosent happen, I can only get PCM (stereo) sound. I have all Intel drivers installed, does anybody have a clue why this is happening?I also been having much trouble updating Windows 10 to the Fall Creators Update since it says I dont have enough space, which is incredible.
Cheers
Macpoedel - Monday, January 15, 2018 - link
Are you using software that supports audio passthrough, and are you playing videos that have Dolby Digital 5.1 or DTS encoded audio tracks (probably otherwise you wouldn't be asking)?I have a NUC6CAYH and have no problems passing through DTS(-HD) from Kodi 17, but I do so over HDMI.
Badelhas - Thursday, January 18, 2018 - link
I am playing movies with 5.1 and it doesn't work. But the problem comes before even playing the movie. The moment I connect my Sony Home Cinema to my main PC though the Optical out port on the Asus DX Sound-card the home cinema changes from "PCM" to "DIGITAL", showing me that it is working. When I do this with the Intel NUC it doesn't, even selecting Digial Out on the Windows or Realtek Sound settings. Very disappointing, to be honest, and Intel Community administrators have been of no help on their forums...mode_13h - Monday, January 15, 2018 - link
"The Celeron J3455 is a quad-core processor with a 10W TDP. It easily enabled the NUC6CAH to come out on top in all of our benchmarks when compared against other Atom-class systems."Actually, I imagine the combination of dual-channel memory and a desktop-class SSD might've been bigger factors.
mode_13h - Monday, January 15, 2018 - link
BTW, thanks for this review. I'm very interested in such low-power systems.However, I was quite disappointed to see no i3 desktop-class system used in any of the comparisons besides the first. It's relevant and important to know how much performance one is sacrificing, when going with a low power "Atom-class" CPU. It would've been appreciated and appropriate at least to include the next higher model of NUC.
I hope that you address this if/when you review a Gemini Lake NUC.
Badelhas - Thursday, January 18, 2018 - link
This is not an Atom but a Celerom, much better.mode_13h - Thursday, January 18, 2018 - link
At the end of the day, those are just brand names. Both are still in use, actually, but I was referring to its lineage.IMO, highlighting it as a "Celeron" muddies the waters, since Intel has shipped Celerons with mainstream (e.g. Skylake) cores, yet this uses the low-power Goldmont core.
nevcairiel - Tuesday, January 16, 2018 - link
I would've liked performance comparisons to the previous generation NUC in the same price class, ie. the one this one replaces. Seeing the clear generational gain would've been sweet.Macpoedel - Wednesday, January 17, 2018 - link
The previous generation low-end NUCs had mobile Braswell CPU's (NUC5CPYH had a Celeron N3050 and NUC5PPYH had a Pentium N3700). It's not exactly the same, but the AsRock Beebox N3000 is a pretty good approximate for the N3050 NUC, it's also a dual core and the burst clock speed isn't that much lower.The NUC6CAYH is more of a successor to the NUC5CPYH in pricing, but the Celeron J3455 in this NUC performs more like the Pentium based predecessor, so the gains are pretty big. You can see that it's twice as fast in a lot of benchmarks, mostly because the amount of cores doubled. Power consumption has gone up as well, but that's also because the newer NUC's CPU has a greater power envelop, so it'll spend more time at boost speeds.
But, having a NUC6CAYH myself, I was a bit disappointed with the performance. It's totally adequate for use as a HTPC or as a low power desktop (if you only edit documents or surf some webpages, but don't multitask too much), but the Core based NUCs are a lot faster (the i3 version costs twice as much though, I would be interested in a Kaby Lake Celeron based NUC like the original Sandy Bridge NUC).
mikato - Wednesday, January 17, 2018 - link
Now we really need an AMD Zen APU UCFF to compare. Is Zotac making a Zbox with one when they come out maybe?