Intel NUC6CAYH (Arches Canyon) Apollo Lake UCFF PC Review
by Ganesh T S on January 12, 2018 8:00 AM EST- Posted in
- Systems
- Intel
- NUC
- UCFF
- Apollo Lake
- Arches Canyon
Performance Metrics - I
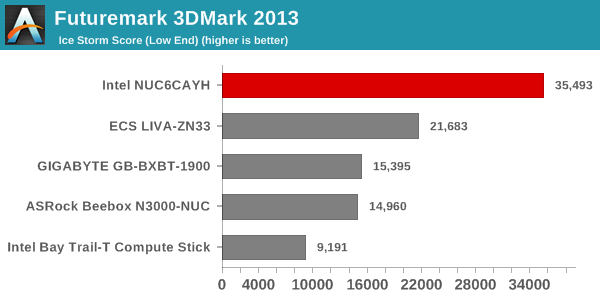
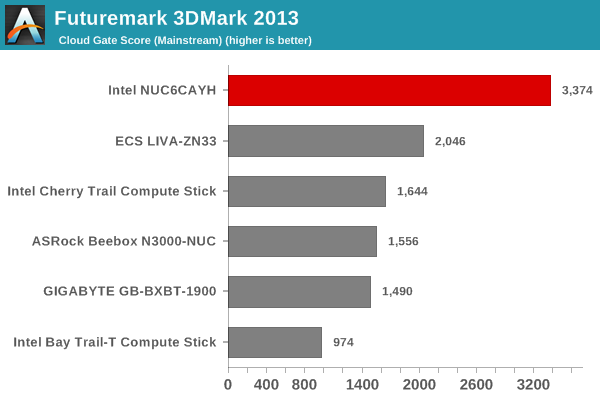
The Intel NUC6CAYH was evaluated using our standard test suite for low power desktops / industrial PCs. Not all benchmarks were processed on all the machines due to updates in our testing procedures. Therefore, the list of PCs in each graph might not be the same. In the first section, we will be looking at SYSmark 2014 SE, as well as some of the Futuremark benchmarks.
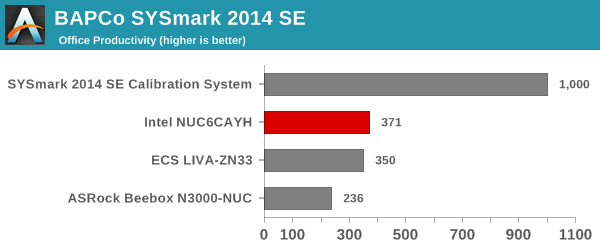
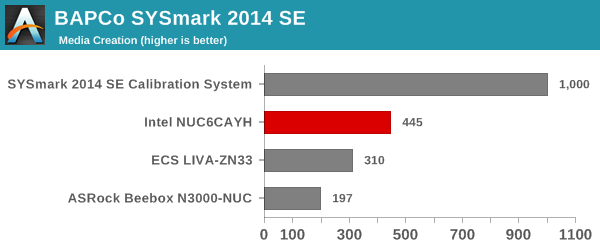
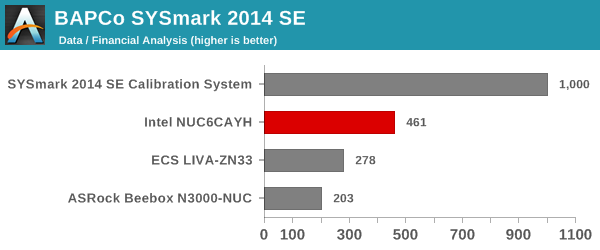
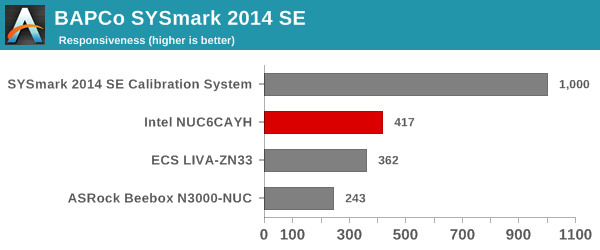
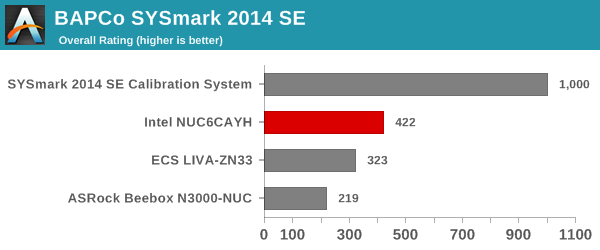
BAPCo SYSmark 2014 SE
BAPCo's SYSmark 2014 SE is an application-based benchmark that uses real-world applications to replay usage patterns of business users in the areas of office productivity, media creation and data/financial analysis. In addition, it also addresses the responsiveness aspect which deals with user experience as related to application and file launches, multi-tasking etc. Scores are meant to be compared against a reference desktop (the SYSmark 2014 SE calibration system in the graphs below). While the SYSmark 2014 benchmark used a Haswell-based desktop configuration, the SYSmark 2014 SE makes the move to a Lenovo ThinkCenter M800 (Intel Core i3-6100, 4GB RAM and a 256GB SATA SSD). The calibration system scores 1000 in each of the scenarios. A score of, say, 2000, would imply that the system under test is twice as fast as the reference system.
The graphs below shows that the two extra cores and slightly higher speeds in the Celeron J3455 give the NUC6CAYH a distinct boost over the Celeron N3350 in the ECS LIVA-ZN33.
SYSmark 2014 SE also adds energy measurement to the mix. A high score in the SYSmark benchmarks might be nice to have, but, potential customers also need to determine the balance between power consumption and the efficiency of the system. For example, in the average office scenario, it might not be worth purchasing a noisy and power-hungry PC just because it ends up with a 2000 score in the SYSmark 2014 SE benchmarks. In order to provide a balanced perspective, SYSmark 2014 SE also allows vendors and decision makers to track the energy consumption during each workload. In the graphs below, we find the total energy consumed by the PC under test for a single iteration of each SYSmark 2014 SE workload and how it compares against the calibration systems.
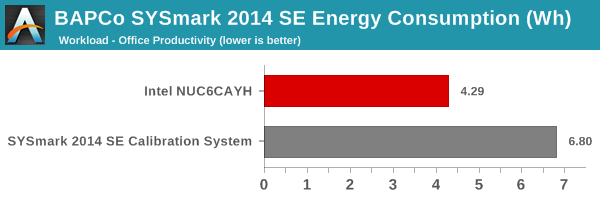
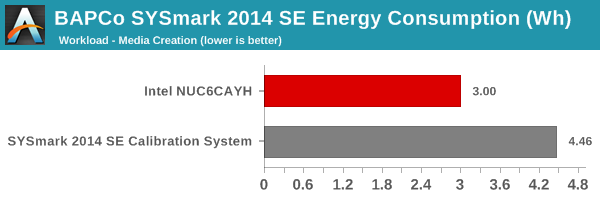

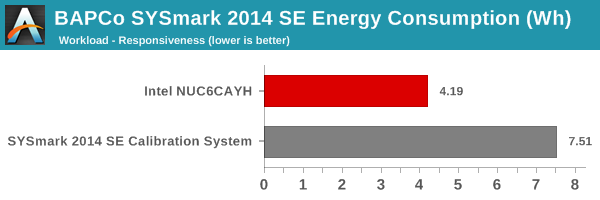
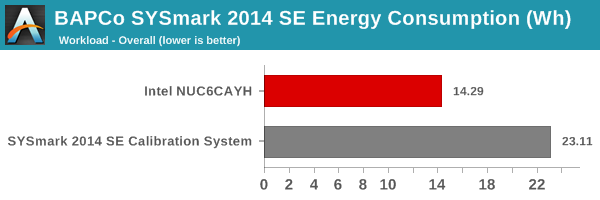
The energy numbers are no big surprise, with the calibration system utilizing a proper desktop CPU compared to the nettop variant used in the NUC6CAYH.
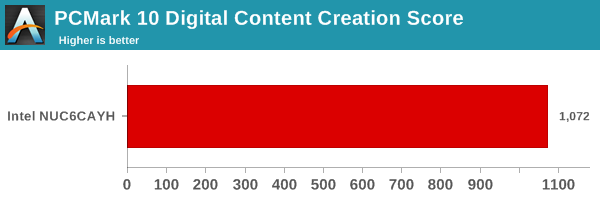
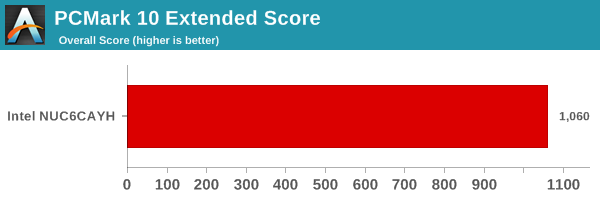
Futuremark PCMark 10
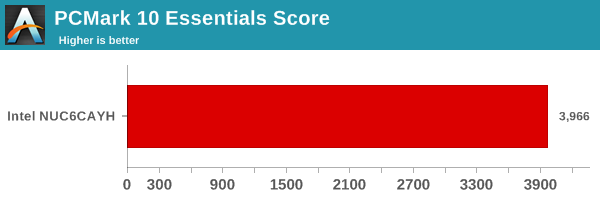
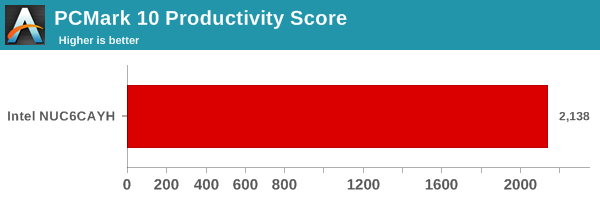
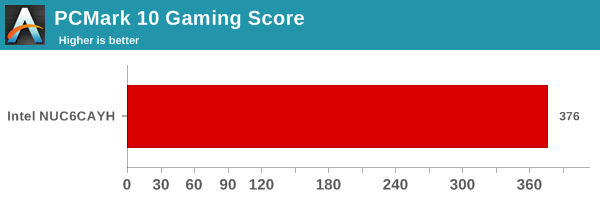
UL's PCMark 10 evaluates computing systems for various usage scenarios (generic / essential tasks such as web browsing and starting up applications, productivity tasks such as editing spreadsheets and documents, gaming, and digital content creation). We benchmarked select PCs with the PCMark 10 Extended profile and recorded the scores for various scenarios. These scores are heavily influenced by the CPU and GPU in the system, though the RAM and storage device also play a part. The power plan was set to Balanced for all the PCs while processing the PCMark 10 benchmark. We do not have PCMark 10 scores of any other Atom-class PC to compare against yet.
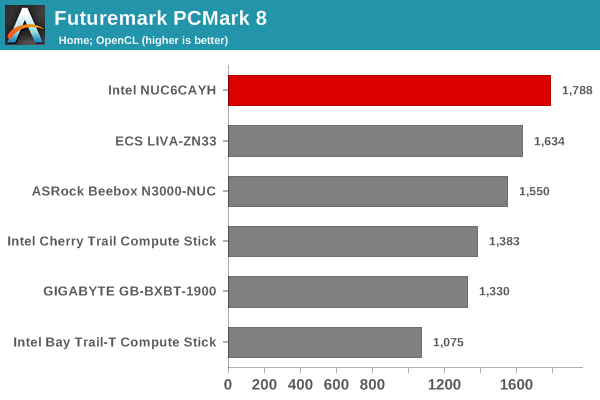
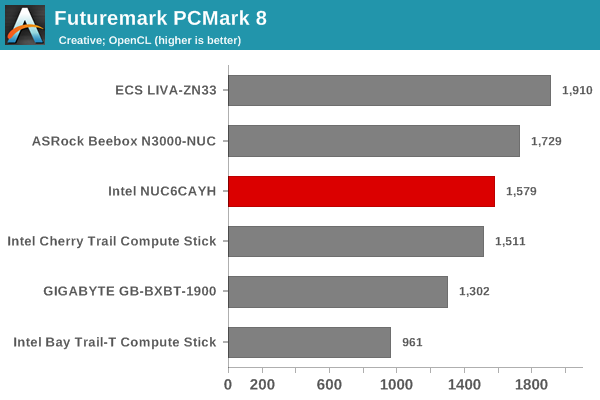
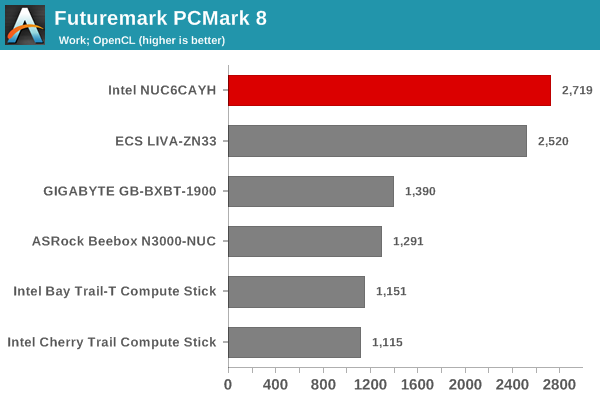
Futuremark PCMark 8
We continue to present PCMark 8 benchmark results (as those have more comparison points) while our PCMark 10 scores database for systems grows in size. PCMark 8 provides various usage scenarios (home, creative and work) and offers ways to benchmark both baseline (CPU-only) as well as OpenCL accelerated (CPU + GPU) performance. We benchmarked select PCs for the OpenCL accelerated performance in all three usage scenarios. These scores are heavily influenced by the CPU in the system. As expected, the Celeron J3455 ends up on top in almost all the benchmarks.
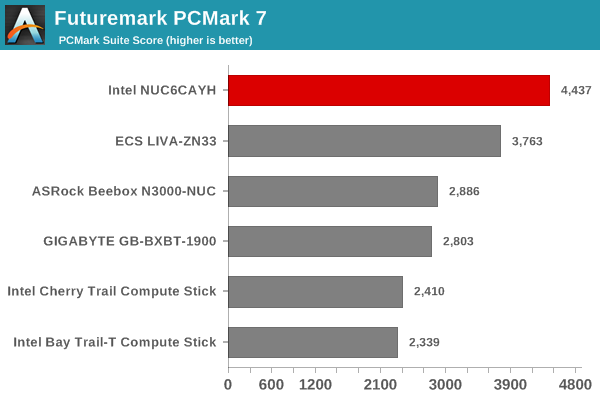
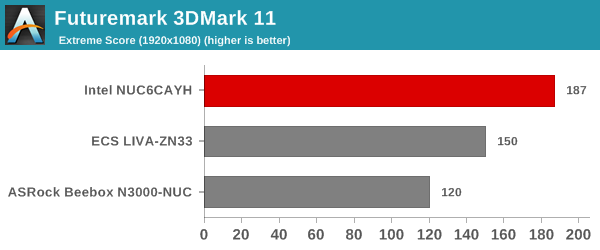
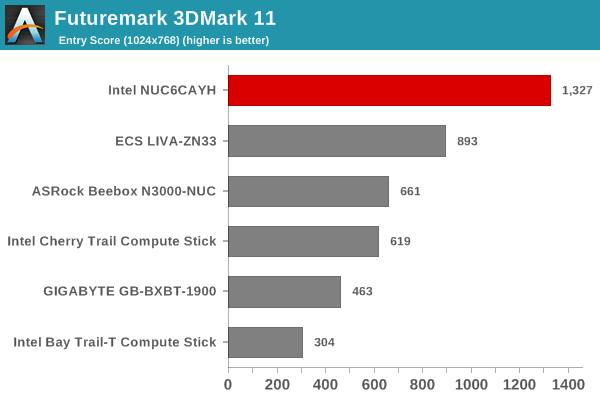
Miscellaneous Futuremark Benchmarks
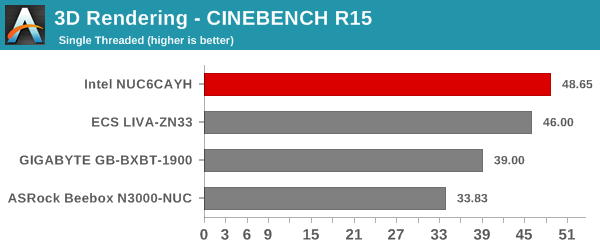
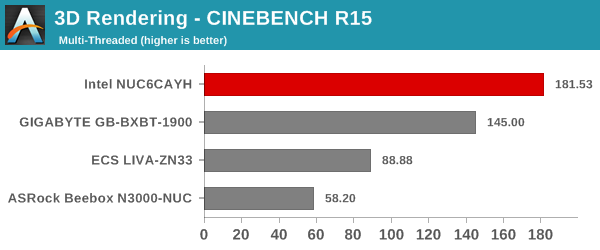
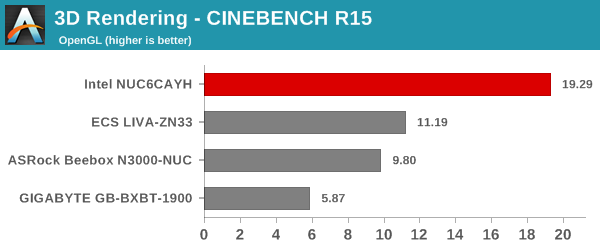
3D Rendering - CINEBENCH R15
We have moved on from R11.5 to R15 for 3D rendering evaluation. CINEBENCH R15 provides three benchmark modes - OpenGL, single threaded and multi-threaded. Evaluation of select PCs in all three modes provided us the following results. The results confirm what we found in the previous section.


54 Comments
View All Comments
ganeshts - Friday, January 12, 2018 - link
Have you looked at the prices of RAM and flash lately? The Corsair kit was $90 when I was writing this review a week or so back (looks like it is $80 today), and the MX200 is relatively rare to find now (it was $250 when I was writing this). I think the cheapest equivalent today would be the BX300 480GB @ $145. So, the $470 price at the time of writing is probably closer to $355 now.That said, RAM and flash prices are fluctuating wildly due to the recent shortage. Things ought to become stable and a bit cheaper soon.
powellandy - Friday, January 12, 2018 - link
Do you have any comment on the ability to play 3D - looks like it's an ongoing saga with Intel chips -https://communities.intel.com/thread/112109
bill44 - Saturday, January 13, 2018 - link
Been following that thread, which is now dead. Intel won't/can't fix it. If they could, they've done it by now. Not enough customer complained (not to mention, 3D for the industry is dead), as such it just gets dragged out until everyone gives up.Going into the future, native HDMI 2.x may fix the issue, but going by past experience, there will always be problems with a HTPC setup (check out MadVR Madshi forums regarding constant driver issues).
powellandy - Monday, January 15, 2018 - link
I agree, but I was hoping if they mention it in the review and perhaps ask Intel it would put a bit of pressure on them to fix it!bji - Friday, January 12, 2018 - link
Do the benchmarks include Meltdown and Spectre fixes? If they don't, then the numbers are not accurate.ganeshts - Friday, January 12, 2018 - link
The benchmark numbers were processed before the security fixes started coming in. The relative numbers are still accurate when you compare one unit against the other (all of them in the comparison graphs are Intel-based systems).We are waiting for the dust to settle on all security fixes before embarking on any benchmark numbers regeneration procedures.
satai - Friday, January 12, 2018 - link
Some comparison to Core Ms would be nice.fuzzymath10 - Friday, January 12, 2018 - link
It's just "feel" based, but I bought my NUC (the same one + old Intel 320 160GB + 8GB ram + W10 Pro) to play videos on my 4k TV. Before, I temporarily used my Venue 7140 Pro with the 5Y10. The 5Y10 is faster for pretty much any "normal" task such as internet browsing which shouldn't be a surprise. Raw multithreaded might be more similar but the Core M is a smoother overall experience.However, the NUC supports 4k @ 60Hz while the HDMI from my Venue is only good to 30Hz. The NUC IGP can also decode HEVC while the HD 5300 in the Venue cannot, and the 5Y10 is not fast enough to software-decode most HEVC content (neither can the J3455). The Core M is also passively cooled while the NUC is semi-passive (fan can shut off).
Unfortunately, Core M is also very expensive. However, I would say the jump in user experience from the NUC to Core M is greater than from Core M to my desktop (i7 3770).
lilmoe - Friday, January 12, 2018 - link
Call me when Intel is capable of delivering anything remotely equal in terms of video/streaming playback performance and efficiency as my 2 year old Galaxy S7.Such incompetence, what a joke.
Hixbot - Friday, January 12, 2018 - link
Are you kidding? This nuc is leaps and bounds more powerful that your smartphone.