Cryptomining Demand Drives Exceptionally High Graphics Card Shipments in Q2 2017
by Nate Oh on August 25, 2017 2:00 PM EST
This week, Jon Peddie Research (JPR) reported significantly higher discrete GPU shipments for Q2 2017, attributing the historically unprecedented increase to cryptocurrency mining, specifically to Ethereum mining. As opposed to the cryptocurrency mining demand of a few years ago, JPR notes that the ASIC-resistant nature of Ethereum mining has especially encouraged GPU mining. In terms of discrete desktop graphics market share, AMD gained a few percentage points from NVIDIA, bringing the current balance to AMD’s 29.4% versus NVIDIA’s 70.6%.
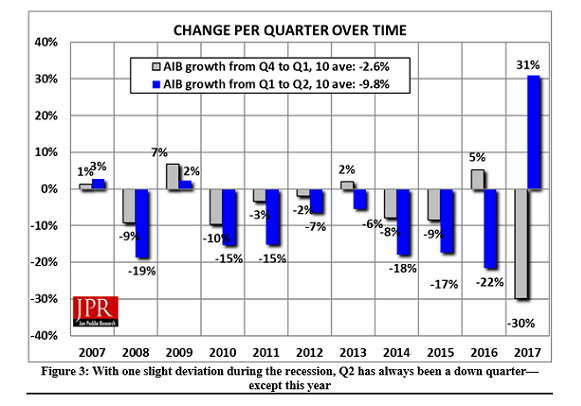
In context, the GPU and PC markets fluctuate in a relatively consistent seasonal pattern: shipments trend flat to down in Q1, notably down in Q2, notably up in Q3, and up to flat in Q4. According to JPR, Q2 2017 has seen an unprecedented 31% increase in discrete GPU shipments from Q1, the first time in over eight years that Q1-to-Q2 shipments have seen an increase at all. Discounting the minor increases during the recession, Q2 has always been the seasonally weak quarter for graphics card shipments.
Drawing a contrast to the limited Bitcoin and Litecoin mining impact on 2013 shipments, JPR identifies the memory-intensive Ethash, Ethereum’s hashing algorithm, as deterring ASIC development for Ethereum mining, and in turn any sudden GPU-displacing bust. That is, during the Bitcoin boom, low cost ASICs displaced GPUs. Consequently, JPR does not see a repeat of market cannibalization by used mining cards. While the diminishing return-on-investment (ROI) will eventually flatten out Ethermining-fueled GPU demand, this quarter saw a direct and significant Ethermining/cryptomining impact on discrete graphics demand.
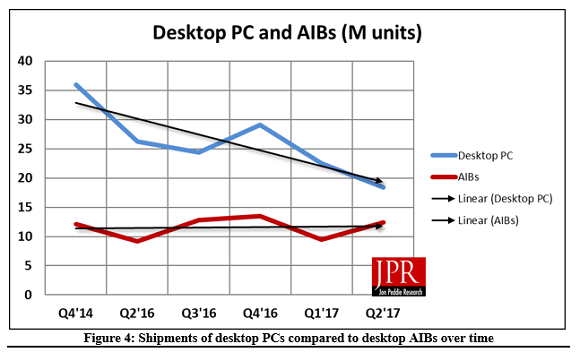
On the back of that cryptomining demand, discrete GPUs have regained market share over integrated GPUs (iGPUs). Weak iGPU and desktop PC shipment numbers continue to reflect the overall declining PC market, while the high-end gaming PC sector continues to be the bright spot for the market. Overall, GPU shipments increased by 7.2% from last quarter.
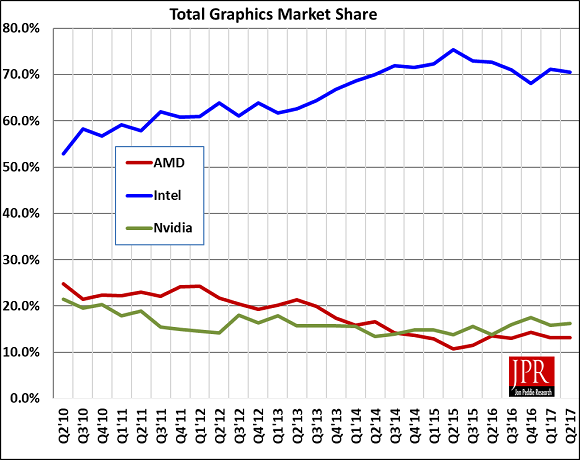
Vendor-wise, JPR reports that AMD’s overall unit shipments increased 7.8% quarter-to-quarter, Intel’s shipments increased 6.3%, and NVIDIA’s shipments increased 10.4%. As mentioned earlier, AMD did gain market share in discrete desktop graphics, but still remains below last year’s market share level.
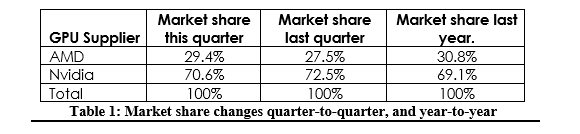
For AMD, their market share is back to Q2 2016 levels of around ~30%. The past year has seen launches of NVIDIA’s Pascal-based consumer cards, as well as of AMD’s Polaris-based RX 400 and 500 series cards; of the latter, the Polaris-based cards were explicitly a volume-play, and did not target the high-end market. To that end, the GTX 1070 and above did not have competition until this month, with AMD’s launch of RX Vega cards, and on the face of it, while Polaris has improved AMD's market share against NVIDIA, it has not made a dramatic difference. As the next few months roll on, the RX Vega cards, as well as Vega 11-based cards, will play a large role in AMD’s aspiring return to its historical 35% – 40% discrete desktop GPU market share.
For cryptomining demand, the remarkable impact on discrete graphics shipments does match up with general reports of mainstream graphics card shortages. When we looked at the discrete graphics market in Q2 and Q3 of 2016, the cryptocurrency mining demand then was nothing like this quarter. Now that the Ethereum mining mania has been quantified into numbers, it has revealed some of the context and reasoning behind cryptomining cards, cryptomining motherboards, and Radeon Pack bundles. And what the numbers reveal is that Ethereum GPU mining has been ridiculous in every sense of the word.
While Ethereum itself will die down eventually, it is anybody’s guess if GPU cryptomining booms will be firmly part of graphics card economics.
Source: Jon Peddie Research


46 Comments
View All Comments
Nate Oh - Friday, August 25, 2017 - link
Apologies, the links were slightly borked by the automatic truncation.https://jonpeddie.com/press-releases/details/add-i...
https://jonpeddie.com/press-releases/details/moder...
JanW1 - Saturday, August 26, 2017 - link
Sorry, still minor snag in my numbers. Should be:"To be compared with the seasonal -12.4%." So we get +4.1% wrt expectations from Q4 to Q2 in 2017 (+21.5% in 2009).
JanW1 - Saturday, August 26, 2017 - link
Oh and this comment should be in response to my other one below.EDIT BUTTON PUHLEEEAAZZE!
JanW1 - Saturday, August 26, 2017 - link
I'm not a graphics card market analyst, nor an economist. But naively looking at this from a supply-and-demand perspective, sales seem to be bound to go up after the huge drop in Q1. Part of it may be ramping up production to build stock prior to the launches of 1080Ti in March, Titan Xp in April and GT1030 in May, absorbing some production capacity in Q1 for cards sold in Q2. Another part may be, as jjj noted earlier, that supply for the other cards in NVidias portfolio, which are much higher volume products, takes months to adjust. If demand was down in Q1, production will not follow immediately. So basically, by the end of Q1 the supply channel was likely sitting on a stockpile of unsold graphics cards (just released, soon to be released and older models). Should they throw them in the bin? These cards are bound to be sold one way or another, mechanically increasing sales in the following quarters.On the numbers, my math was wrong. At these fractions, -30% followed by +31% is not +1%, but rater 100%*(0.7*1.31-1)=-8.3%. To be compared with the seasonal -9.8%. That's nothing. Zero, zilch, nada. Look at 2009, where sales increased by 100%*(1.07*1.02-1)=9.1%, up 19% wrt to the seasonal average. If there is anything historically unprecedented here, it's the drop in Q1 2017, not the return to seasonality in Q2.
I'm just saying that the way the numbers are portrayed in the article, it sounds like we are looking at a 40% increase in total demand wrt expectations, whereas we are really looking at +1.5%. The latter sounds less sexy but more realistic.
Yojimbo - Saturday, August 26, 2017 - link
"I'm not a graphics card market analyst, nor an economist."Neither am I.
"But naively looking at this from a supply-and-demand perspective, sales seem to be bound to go up after the huge drop in Q1."
In certain contexts that's true. Certainly if supply were an issue and there was pent up demand that would be vert reasonable. In certain contexts buying decisions are based on some external timing like funding availability. Purchases are going to be made, it's just a matter of when. In a case like that strong demand would be expected to follow weak demand. But from what I have seen in the consumer graphics card market that doesn't tend to happen. As far as I know, that doesn't fit this case. Consumers in general are affected by the economy and anxiety about the economy. In terms of graphics cards, consumers are further affected by new games releases. I don't follow games releases that closely but I don't think there was an unusual influx of popular and graphics-demanding titles in Q2 this year nor an unusual dearth in Q1.
"Part of it may be ramping up production to build stock prior to the launches of 1080Ti in March, Titan Xp in April and GT1030 in May, absorbing some production capacity in Q1 for cards sold in Q2."
Again, supply was not the issue in Q1. There was plenty of supply. Lack of Q1 sales was entirely due to lack of demand. And excess supply doesn't create more demand, so building up supply in Q1 won't increase sales in Q2.
"Another part may be, as jjj noted earlier, that supply for the other cards in NVidias portfolio, which are much higher volume products, takes months to adjust. If demand was down in Q1, production will not follow immediately."
This is an argument for lower sales, not greater sales. If they cut production on Q1 because of weakened demand and it takes months to restart production to eventually get new cards out to retailers, then when demand unexpectedly picked up in Q2 they would not have been able to respond to demand, reducing sales, not increasing them. It's possible that this happened but it does nothing to explain either the low Q1 sales or the high Q2 sales, or any link between Q1 and Q2 sales.
So basically, by the end of Q1 the supply channel was likely sitting on a stockpile of unsold graphics cards (just released, soon to be released and older models). Should they throw them in the bin? These cards are bound to be sold one way or another, mechanically increasing sales in the following quarters."
"So basically, by the end of Q1 the supply channel was likely sitting on a stockpile of unsold graphics cards (just released, soon to be released and older models). Should they throw them in the bin? These cards are bound to be sold one way or another, mechanically increasing sales in the following quarters."
The cards aren't "bound to be sold". They will sell only if the demand exists. Sure retailers could cut prices to try to sell the cards through, as there would be increased demand at lower prices, but that isn't what happened. Prices actually went up, because demand was stronger than expected and outstripped supply. The supply and the demand are independent factors that both must meet in order to make a sale. You keep trying to explain everything entirely with supply.
"I'm just saying that the way the numbers are portrayed in the article, it sounds like we are looking at a 40% increase in total demand wrt expectations, whereas we are really looking at +1.5%. The latter sounds less sexy but more realistic."
But yet you argued against this interpretation yourself above when you said "Another part may be, as jjj noted earlier, that supply for the other cards in NVidias portfolio, which are much higher volume products, takes months to adjust. If demand was down in Q1, production will not follow immediately. So basically, by the end of Q1 the supply channel was likely sitting on a stockpile of unsold graphics cards." The only reason they would cut production after weak demand in Q1 is if they expected Q2 to continue to be weak. If the natural expectation were to rebound, as you are suggesting it should be, they would expect the rebound and continue with normal production. You and I may not be graphics card market analysts but you can bet that those making production decisions at AMD and NVIDIA are. What you are doing is tacitly assuming dependence of Q2's strength with Q1's weakness. It doesn't work that way. By AMD's and NVIDIA's decisions and JPR's report we can see that the actual experts don't believe that it works that way. When demand was weak in Q1 they fully expected weakness to be maintained into Q2, or at least they didn't expect Q2 demand to "make up for" the weak Q1 demand. And this isn't just guesswork on their parts. They gather a lot of data, they analyze it both quantitatively and with their own judgment.
BurntMyBacon - Monday, August 28, 2017 - link
@YojimboIs it possible that during the etherium ramp up, demand for cheaper second hand and older generation graphics cards was higher than demand for current generation cards (for miners) and somehow contributed to stalling demand for new cards in Q1? I realize that gamers don't really card what miners are doing (until if affects their prices) and that the sale of a second hand card is often followed by the purchase of a new card which could actually cause a temporary spike in sales due to lower total cost of entry. However, I've already read many public statements from people who claim to have sold their graphics cards to cash in on the boom and decided to make due with whatever else they had available until some later date (1080Ti, summer sales, Vega, Volta, etc.). It is conceivable that some of the drop in shipments may have come from this type of second hand sell and wait scenario. If AMD / nVidia then decided to drop production for Q2 to reflect weaker Q1 sales, as long as they didn't cut too hard (which I doubt they would have with the largest predicted increase in shipments typically slated for Q3), they would end with a scenario of underestimating demand for Q2, but still being able to pull from their stockpile to offset some(most?) of that. Keep in mind that a 30% drop in shipments followed by a 31% increase in shipments does not bring you back to parity: (100(%)*0.7)*1.31=91.7%. While the trend is certainly better than it has been, the Q4 - Q2 trend is looking pretty similar to 2012 (-8.3% vs -8.9%). Your thoughts?
Yojimbo - Monday, August 28, 2017 - link
""It is conceivable that some of the drop in shipments may have come from this type of second hand sell and wait scenario."By "some" what do you mean? We are talking about swings of millions of units. I find it hard to believe that millions of gamers sold their graphics cards to miners in Q1 and then waited until Q2 to replace them. The Ethereum craze didn't start until Q2, anyway. Ether wasn't regularly above $50 until the end of April and wasn't regularly above $100 until the middle of May. I don't think Ethereum was much of an issue at all in Q1. If it were, Q1 new graphics cards sales wouldn't have been weak. Most mining is done by, and most mining cards are owned by, big mining farms that purchase in volume, not off ebay. When you take into account the size of the GPU mining market and you note that it accounts for millions of units, you must note that the bulk of those units are from large mining operations in the Far East and Eastern Europe. Once you throw those out, because they aren't getting supplied by the used card market, you no longer have that type of volume you need, even during the height of the craze in late Q2, let alone Q1 before the craze kicked off. Miners weren't buying a million+ used older generation cards in Q1. Furthermore, the number of those who would have sold their cards but delayed their purchase of a replacement into Q2 would have been well under the total.
"If AMD / nVidia then decided to drop production for Q2 to reflect weaker Q1 sales, as long as they didn't cut too hard (which I doubt they would have with the largest predicted increase in shipments typically slated for Q3), they would end with a scenario of underestimating demand for Q2, but still being able to pull from their stockpile to offset some(most?) of that."
This may be entirely true. But supply is not the issue here. The demand was low in Q1 and high in Q2. That's the issue.
"While the trend is certainly better than it has been, the Q4 - Q2 trend is looking pretty similar to 2012 (-8.3% vs -8.9%)."
If we zoom out far enough so we no longer have the resolution to be able to see the issue then the issue just magically disappears :P Sorry for the sarcasm.
BurntMyBacon - Thursday, August 31, 2017 - link
@Yojimbo: "I find it hard to believe that millions of gamers sold their graphics cards to miners in Q1 and then waited until Q2 to replace them."I was also considering (though I didn't state) a scenario where normal people who had little knowledge or interest in mining just happened to be selling their old card (there is a very large second hand market) and held off getting a new card when the card they wanted started shifting up in price. However:
@Yojimbo: "The Ethereum craze didn't start until Q2, anyway. Ether wasn't regularly above $50 until the end of April and wasn't regularly above $100 until the middle of May. I don't think Ethereum was much of an issue at all in Q1."
This kinda puts a damper on the whole theory. It does seem unlikely, given this information, that mining affected much in Q1, leaving the abnormal drop in Q1 sales a mystery unsolved.
@Yojimbo: "This may be entirely true. But supply is not the issue here. The demand was low in Q1 and high in Q2. That's the issue."
I think I'm understanding your perspective, but this statement bugs me. You can't truly separate supply and demand. If you have 50% higher than average demand, but you produced 200% more units, you still have an oversupply despite the increased demand. Supply will continue to be considered high until inventory starts to clear. Likewise, if you produce 30% fewer units but your demand only decreased 5%, you still have an under-supply despite the decreased demand. High supply <the state of having more inventory than will sell at the set price> is always relative to demand <the amount of an item that will sell at a set price>, or vice versa depending on the the perspective you want to look at it from.
@Yojimbo: "If we zoom out far enough so we no longer have the resolution to be able to see the issue then the issue just magically disappears :P Sorry for the sarcasm."
Sarcasm doesn't really bug me. It was just a theory based on limited information and I did ask for your thoughts on it (thank you for that). That said, it really doesn't fit well in the context of what I stated. While it is true that zooming out does obscure details like swings in sales and short term market trends, it does give a better perspective of the big picture. Zooming in too far without a consistent point of reference, as that first chart does, can also give the wrong picture. The shipment numbers in the first chart are not absolute numbers, they are relative to the previous quarters shipments (they should have included Q3 and Q4 or just stuck to absolute numbers instead of relative percentages). The AIB line graph illustrates my point. While there is a massive percentage upswing in shipments for Q2'17, the preceding downswing in Q1'17 means the actual numbers shipped were still lower than Q4'16 or even Q3'16. Again, I'm not necessarily disagreeing with your overall assessment, just trying to keep things in perspective.
ABR - Saturday, August 26, 2017 - link
I agree, between the 30% drop the quarter before and the 31% increase now, there's basically no change at all, and in other words, no content behind the story.someonesomewherelse - Saturday, October 14, 2017 - link
Except the fact that a rx 570 now costs ~400 eur and isn't even in stock while in Q1 it was 2something eur and in stock.